Data
78,625 items of data are available, covering 74,332 participants.
Defined-instances run from 2 to 3, labelled using Instancing
2.
Units of measurement are ms.
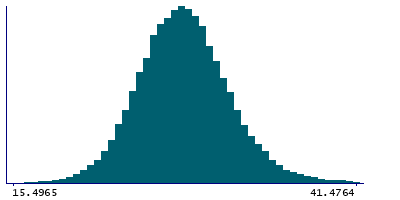
| Maximum | 55.6404 |
| Decile 9 | 33.0461 |
| Decile 8 | 31.3274 |
| Decile 7 | 30.1813 |
| Decile 6 | 29.2623 |
| Median | 28.4172 |
| Decile 4 | 27.5614 |
| Decile 3 | 26.6637 |
| Decile 2 | 25.6214 |
| Decile 1 | 24.169 |
| Minimum | 0 |
|
|
- Mean = 28.5468
- Std.dev = 3.64118
- 19 items below graph minimum of 15.2919
- 213 items above graph maximum of 41.9232
|
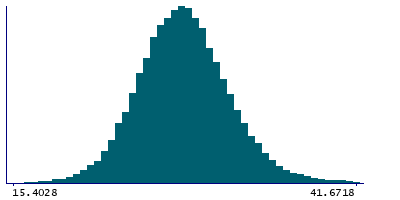
2 Instances
Instance 2 : Imaging visit (2014+)
73,987 participants, 73,987 items
| Maximum | 55.6404 |
| Decile 9 | 33.0538 |
| Decile 8 | 31.3233 |
| Decile 7 | 30.18 |
| Decile 6 | 29.26 |
| Median | 28.4172 |
| Decile 4 | 27.5598 |
| Decile 3 | 26.6558 |
| Decile 2 | 25.6128 |
| Decile 1 | 24.1561 |
| Minimum | 0 |
|
|
- Mean = 28.5433
- Std.dev = 3.64865
- 17 items below graph minimum of 15.2585
- 197 items above graph maximum of 41.9514
|
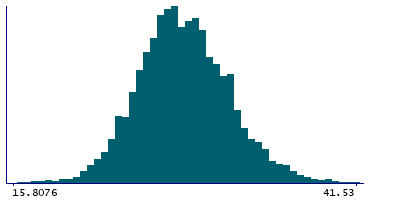
Instance 3 : First repeat imaging visit (2019+)
4,638 participants, 4,638 items
| Maximum | 48.0864 |
| Decile 9 | 32.9574 |
| Decile 8 | 31.3909 |
| Decile 7 | 30.2224 |
| Decile 6 | 29.3217 |
| Median | 28.4165 |
| Decile 4 | 27.5835 |
| Decile 3 | 26.757 |
| Decile 2 | 25.7761 |
| Decile 1 | 24.3819 |
| Minimum | 13.0946 |
|
|
- Mean = 28.602
- Std.dev = 3.51946
- 2 items below graph minimum of 15.8065
- 14 items above graph maximum of 41.5328
|
Notes
Median T2star in left pallidum (from SWI data)
0 Related Data-Fields
There are no related data-fields
2 Applications
| Application ID | Title |
|---|
| 17689 | Genetic, environmental and lifestyle predictors of brain/cognitive-related outcomes. |
| 22783 | The joint analysis of imaging data and genetic data for early tumor detection, prevention, diagnosis and treatment |


