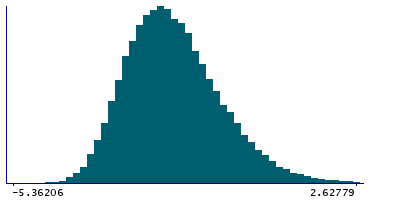
Data
51,746 items of data are available, covering 48,171 participants.
Defined-instances run from 2 to 3, labelled using Instancing
2.
Units of measurement are Std.Devs.
| Maximum | 7.46581 |
| Decile 9 | -0.153542 |
| Decile 8 | -0.740674 |
| Decile 7 | -1.13997 |
| Decile 6 | -1.4508 |
| Median | -1.73618 |
| Decile 4 | -1.99829 |
| Decile 3 | -2.27058 |
| Decile 2 | -2.5644 |
| Decile 1 | -2.93466 |
| Minimum | -5.36206 |
|
|
- Mean = -1.61995
- Std.dev = 1.11043
- 92 items above graph maximum of 2.62758
|
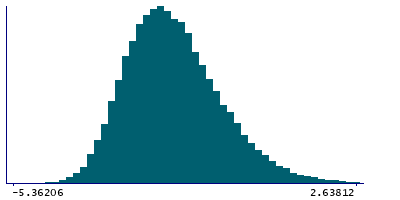
2 Instances
Instance 2 : Imaging visit (2014+)
47,739 participants, 47,739 items
| Maximum | 7.46581 |
| Decile 9 | -0.148283 |
| Decile 8 | -0.736523 |
| Decile 7 | -1.13937 |
| Decile 6 | -1.4493 |
| Median | -1.73438 |
| Decile 4 | -1.99747 |
| Decile 3 | -2.26891 |
| Decile 2 | -2.56231 |
| Decile 1 | -2.93459 |
| Minimum | -5.36206 |
|
|
- Mean = -1.61788
- Std.dev = 1.11268
- 84 items above graph maximum of 2.63802
|
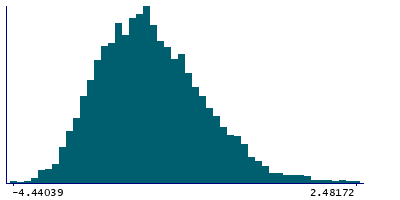
Instance 3 : First repeat imaging visit (2019+)
4,007 participants, 4,007 items
| Maximum | 3.62673 |
| Decile 9 | -0.227176 |
| Decile 8 | -0.774067 |
| Decile 7 | -1.15446 |
| Decile 6 | -1.47957 |
| Median | -1.74734 |
| Decile 4 | -2.00494 |
| Decile 3 | -2.28118 |
| Decile 2 | -2.57668 |
| Decile 1 | -2.93607 |
| Minimum | -4.44039 |
|
|
- Mean = -1.64458
- Std.dev = 1.08307
- 8 items above graph maximum of 2.48172
|