Data
50,080 items of data are available, covering 46,629 participants.
Defined-instances run from 2 to 3, labelled using Instancing
2.
Units of measurement are Std.Devs.
| Maximum | 7.84862 |
| Decile 9 | -0.0959272 |
| Decile 8 | -0.689163 |
| Decile 7 | -1.07957 |
| Decile 6 | -1.40554 |
| Median | -1.69345 |
| Decile 4 | -1.96437 |
| Decile 3 | -2.24016 |
| Decile 2 | -2.54203 |
| Decile 1 | -2.91553 |
| Minimum | -6.14148 |
|

|
- Mean = -1.57914
- Std.dev = 1.12741
- 1 item below graph minimum of -5.73513
- 88 items above graph maximum of 2.72367
|
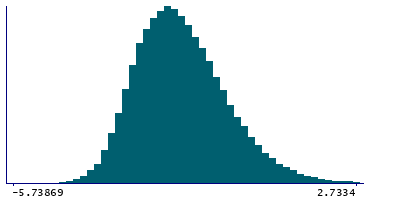
2 Instances
Instance 2 : Imaging visit (2014+)
46,175 participants, 46,175 items
| Maximum | 7.84862 |
| Decile 9 | -0.0905236 |
| Decile 8 | -0.687497 |
| Decile 7 | -1.07942 |
| Decile 6 | -1.40667 |
| Median | -1.69463 |
| Decile 4 | -1.96293 |
| Decile 3 | -2.23957 |
| Decile 2 | -2.54181 |
| Decile 1 | -2.91463 |
| Minimum | -6.14148 |
|
|
- Mean = -1.57816
- Std.dev = 1.12906
- 1 item below graph minimum of -5.73873
- 82 items above graph maximum of 2.73358
|
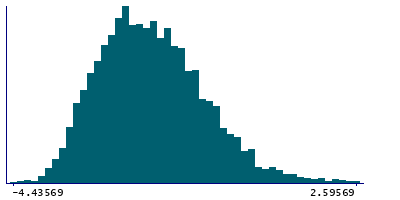
Instance 3 : First repeat imaging visit (2019+)
3,905 participants, 3,905 items
| Maximum | 3.45649 |
| Decile 9 | -0.165662 |
| Decile 8 | -0.702058 |
| Decile 7 | -1.08025 |
| Decile 6 | -1.39422 |
| Median | -1.68293 |
| Decile 4 | -1.9811 |
| Decile 3 | -2.24419 |
| Decile 2 | -2.54976 |
| Decile 1 | -2.92701 |
| Minimum | -4.43569 |
|
|
- Mean = -1.59074
- Std.dev = 1.10771
- 9 items above graph maximum of 2.59569
|