Data
601,572 items of data are available, covering 465,076 participants.
Some values have special meanings defined by Data-Coding
100291.
Defined-instances run from 0 to 3, labelled using Instancing
2.
Units of measurement are hours/week.
| Maximum | 168 |
| Decile 9 | 1 |
| Decile 8 | 0 |
| Decile 7 | 0 |
| Decile 6 | 0 |
| Median | 0 |
| Decile 4 | 0 |
| Decile 3 | 0 |
| Decile 2 | 0 |
| Decile 1 | 0 |
| Minimum | 0 |
|
|
- There are 75 distinct values.
- Mean = 0.436873
- Std.dev = 2.31193
- 18428 items above graph maximum of 2
- 1266 items have value -3 (Prefer not to answer)
- 48185 items have value -1 (Do not know)
|
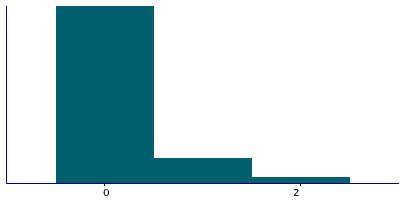
4 Instances
Instance 0 : Initial assessment visit (2006-2010) at which participants were recruited and consent given
462,239 participants, 462,239 items
| Maximum | 168 |
| Decile 9 | 1 |
| Decile 8 | 0 |
| Decile 7 | 0 |
| Decile 6 | 0 |
| Median | 0 |
| Decile 4 | 0 |
| Decile 3 | 0 |
| Decile 2 | 0 |
| Decile 1 | 0 |
| Minimum | 0 |
|

|
- There are 74 distinct values.
- Mean = 0.514752
- Std.dev = 2.55254
- 16932 items above graph maximum of 2
- 1195 items have value -3 (Prefer not to answer)
- 39878 items have value -1 (Do not know)
|
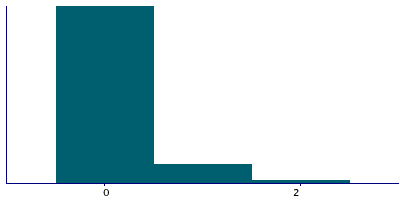
Instance 1 : First repeat assessment visit (2012-13)
19,667 participants, 19,667 items
| Maximum | 60 |
| Decile 9 | 1 |
| Decile 8 | 0 |
| Decile 7 | 0 |
| Decile 6 | 0 |
| Median | 0 |
| Decile 4 | 0 |
| Decile 3 | 0 |
| Decile 2 | 0 |
| Decile 1 | 0 |
| Minimum | 0 |
|
|
- There are 27 distinct values.
- Mean = 0.239623
- Std.dev = 1.37632
- 297 items above graph maximum of 2
- 15 items have value -3 (Prefer not to answer)
- 1198 items have value -1 (Do not know)
|
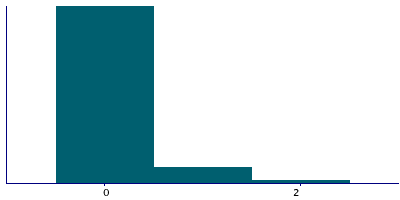
Instance 2 : Imaging visit (2014+)
98,995 participants, 98,995 items
| Maximum | 84 |
| Decile 9 | 1 |
| Decile 8 | 0 |
| Decile 7 | 0 |
| Decile 6 | 0 |
| Median | 0 |
| Decile 4 | 0 |
| Decile 3 | 0 |
| Decile 2 | 0 |
| Decile 1 | 0 |
| Minimum | 0 |
|
|
- There are 39 distinct values.
- Mean = 0.185455
- Std.dev = 1.2371
- 1047 items above graph maximum of 2
- 49 items have value -3 (Prefer not to answer)
- 6050 items have value -1 (Do not know)
|
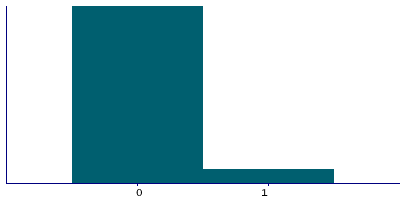
Instance 3 : First repeat imaging visit (2019+)
20,671 participants, 20,671 items
| Maximum | 56 |
| Decile 9 | 0 |
| Decile 8 | 0 |
| Decile 7 | 0 |
| Decile 6 | 0 |
| Median | 0 |
| Decile 4 | 0 |
| Decile 3 | 0 |
| Decile 2 | 0 |
| Decile 1 | 0 |
| Minimum | 0 |
|
|
- There are 21 distinct values.
- Mean = 0.140831
- Std.dev = 0.985179
- 314 items above graph maximum of 1
- 7 items have value -3 (Prefer not to answer)
- 1059 items have value -1 (Do not know)
|
Notes
ACE touchscreen question "Outside of your home, about how many hours per WEEK are you exposed to other people's tobacco smoke?"
The following checks were performed:
- If answer < 0 then rejected
- If answer > 168 then rejected
- If answer > 100 then participant asked to confirm
If the participant activated the Help button they were shown the message:
Please give the number of hours in a typical week over the
last year that you have been exposed to other people's tobacco
smoke in environments other than the home (include work, pubs,
restaurants etc).
|
Field 1279 was collected from all participants except those who indicated they currently smoke tobacco on most or all days, as defined by their answers to Field 1239
Coding 100291 defines 2 special values:
- -1 represents "Do not know"
- -3 represents "Prefer not to answer"
1 Related Data-Field
| Field ID | Description | Relationship |
|---|
| 1239 | Current tobacco smoking | Current Field was collected from all participants except those who indicated they currently smoke tobacco on most or all days, as defined by their answers to Field 1239 |
1 Application
| Application ID | Title |
|---|
| 2482 | Comparisson of smoking behaviour between men and women to assess risk inducing habits |


