Data
66,611 items of data are available, covering 64,144 participants.
Some values have special meanings defined by Data-Coding
100291.
Defined-instances run from 0 to 3, labelled using Instancing
2.
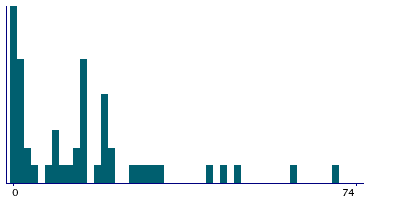
Units of measurement are days.
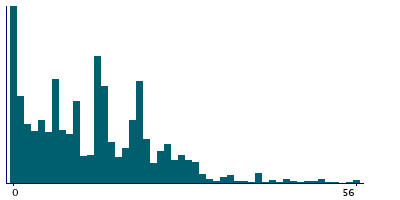
| Maximum | 365 |
| Decile 9 | 28 |
| Decile 8 | 21 |
| Decile 7 | 19 |
| Decile 6 | 14 |
| Median | 13 |
| Decile 4 | 9 |
| Decile 3 | 7 |
| Decile 2 | 3 |
| Decile 1 | 0 |
| Minimum | 0 |
|
|
- There are 162 distinct values.
- Mean = 15.3768
- Std.dev = 22.6404
- 1474 items above graph maximum of 56
- 806 items have value -3 (Prefer not to answer)
- 7526 items have value -1 (Do not know)
|
4 Instances
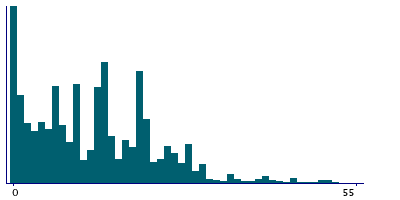
Instance 0 : Initial assessment visit (2006-2010) at which participants were recruited and consent given
63,936 participants, 63,936 items
| Maximum | 365 |
| Decile 9 | 28 |
| Decile 8 | 21 |
| Decile 7 | 19 |
| Decile 6 | 14 |
| Median | 13 |
| Decile 4 | 9 |
| Decile 3 | 7 |
| Decile 2 | 3 |
| Decile 1 | 1 |
| Minimum | 0 |
|
|
- There are 158 distinct values.
- Mean = 15.2283
- Std.dev = 22.3374
- 1437 items above graph maximum of 55
- 744 items have value -3 (Prefer not to answer)
- 7084 items have value -1 (Do not know)
|
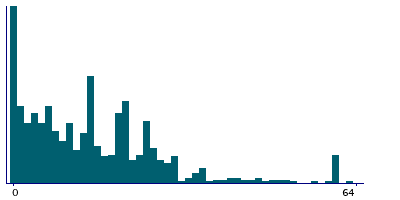
Instance 1 : First repeat assessment visit (2012-13)
1,045 participants, 1,045 items
| Maximum | 365 |
| Decile 9 | 32 |
| Decile 8 | 25 |
| Decile 7 | 20 |
| Decile 6 | 15.5 |
| Median | 14 |
| Decile 4 | 10 |
| Decile 3 | 6 |
| Decile 2 | 3 |
| Decile 1 | 0 |
| Minimum | 0 |
|
|
- There are 65 distinct values.
- Mean = 17.3112
- Std.dev = 23.8856
- 25 items above graph maximum of 64
- 14 items have value -3 (Prefer not to answer)
- 144 items have value -1 (Do not know)
|
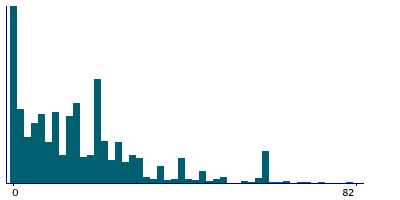
Instance 2 : Imaging visit (2014+)
1,525 participants, 1,525 items
| Maximum | 365 |
| Decile 9 | 42.5 |
| Decile 8 | 28 |
| Decile 7 | 21 |
| Decile 6 | 18 |
| Median | 14 |
| Decile 4 | 10 |
| Decile 3 | 6 |
| Decile 2 | 2 |
| Decile 1 | 0 |
| Minimum | 0 |
|
|
- There are 78 distinct values.
- Mean = 20.7122
- Std.dev = 32.7067
- 44 items above graph maximum of 85
- 41 items have value -3 (Prefer not to answer)
- 268 items have value -1 (Do not know)
|
Instance 3 : First repeat imaging visit (2019+)
105 participants, 105 items
| Maximum | 90 |
| Decile 9 | 47 |
| Decile 8 | 25.5 |
| Decile 7 | 20 |
| Decile 6 | 15 |
| Median | 14 |
| Decile 4 | 5.5 |
| Decile 3 | 1.5 |
| Decile 2 | 0 |
| Decile 1 | 0 |
| Minimum | 0 |
|
|
- There are 29 distinct values.
- Mean = 17.3235
- Std.dev = 21.4555
- 7 items have value -3 (Prefer not to answer)
- 30 items have value -1 (Do not know)
|
Notes
ACE touchscreen question "How many days since your last menstrual period?"
The following checks were performed:
- If answer < 0 then rejected
- If answer > 365 then rejected
- If answer > 60 then participant asked to confirm
If the participant activated the Help button they were shown the message:
Please count from the first day of your last menstrual period
|
Field 3700 was collected from women who indicated that their periods had not stopped (menopause), as defined by their answers to Field 2724
Coding 100291 defines 2 special values:
- -1 represents "Do not know"
- -3 represents "Prefer not to answer"
1 Related Data-Field
| Field ID | Description | Relationship |
|---|
| 2724 | Had menopause | Current Field was collected from women who indicated that their periods had not stopped (menopause), as defined by their answers to Field 2724 |
3 Applications
| Application ID | Title |
|---|
| 26629 | Cross-cultural variations in female reproductive health and non-communicable diseases: analysis of 500,000 participants from the UKBiobank and the InterLACE consortium |
| 5791 | Development and validation of risk prediction model for breast and ovarian cancers |
| 871 | Genetic factors associated with being at different extremes of the reproductive lifespan |


