Data
131,980 items of data are available, covering 109,725 participants.
Some values have special meanings defined by Data-Coding
100291.
Defined-instances run from 0 to 3, labelled using Instancing
2.
Units of measurement are years.
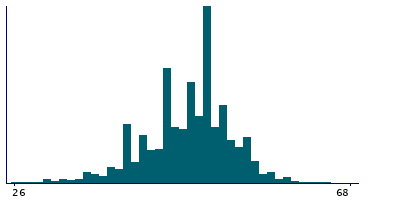
| Maximum | 82 |
| Decile 9 | 54 |
| Decile 8 | 52 |
| Decile 7 | 50 |
| Decile 6 | 50 |
| Median | 48 |
| Decile 4 | 47 |
| Decile 3 | 45 |
| Decile 2 | 43 |
| Decile 1 | 40 |
| Minimum | 16 |
|
|
- There are 66 distinct values.
- Mean = 47.6864
- Std.dev = 5.69027
- 174 items below graph minimum of 26
- 108 items above graph maximum of 68
- 132 items have value -3 (Prefer not to answer)
- 13657 items have value -1 (Do not know)
|
4 Instances
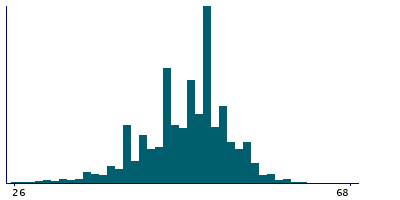
Instance 0 : Initial assessment visit (2006-2010) at which participants were recruited and consent given
103,829 participants, 103,829 items
| Maximum | 70 |
| Decile 9 | 54 |
| Decile 8 | 52 |
| Decile 7 | 50 |
| Decile 6 | 50 |
| Median | 48 |
| Decile 4 | 47 |
| Decile 3 | 45 |
| Decile 2 | 43 |
| Decile 1 | 40 |
| Minimum | 16 |
|
|
- There are 55 distinct values.
- Mean = 47.3778
- Std.dev = 5.44503
- 133 items below graph minimum of 26
- 3 items above graph maximum of 68
- 114 items have value -3 (Prefer not to answer)
- 10571 items have value -1 (Do not know)
|
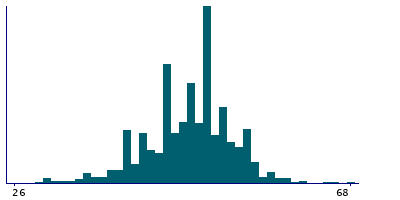
Instance 1 : First repeat assessment visit (2012-13)
4,151 participants, 4,151 items
| Maximum | 68 |
| Decile 9 | 54 |
| Decile 8 | 52 |
| Decile 7 | 50 |
| Decile 6 | 50 |
| Median | 48 |
| Decile 4 | 47 |
| Decile 3 | 45 |
| Decile 2 | 44 |
| Decile 1 | 40 |
| Minimum | 22 |
|
|
- There are 43 distinct values.
- Mean = 47.7594
- Std.dev = 5.37273
- 3 items below graph minimum of 26
- 1 items have value -3 (Prefer not to answer)
- 463 items have value -1 (Do not know)
|
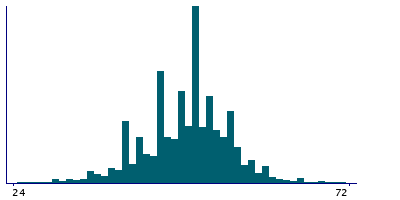
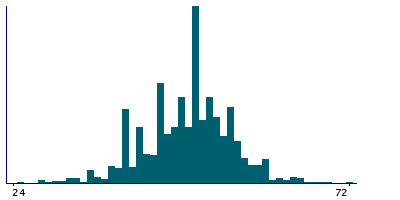
Instance 2 : Imaging visit (2014+)
20,115 participants, 20,115 items
| Maximum | 82 |
| Decile 9 | 56 |
| Decile 8 | 54 |
| Decile 7 | 52 |
| Decile 6 | 50 |
| Median | 50 |
| Decile 4 | 48 |
| Decile 3 | 46 |
| Decile 2 | 44 |
| Decile 1 | 40 |
| Minimum | 16 |
|
|
- There are 63 distinct values.
- Mean = 48.972
- Std.dev = 6.47493
- 16 items below graph minimum of 24
- 25 items above graph maximum of 72
- 17 items have value -3 (Prefer not to answer)
- 2176 items have value -1 (Do not know)
|
Instance 3 : First repeat imaging visit (2019+)
3,885 participants, 3,885 items
| Maximum | 79 |
| Decile 9 | 57 |
| Decile 8 | 55 |
| Decile 7 | 52 |
| Decile 6 | 51 |
| Median | 50 |
| Decile 4 | 48 |
| Decile 3 | 46 |
| Decile 2 | 44 |
| Decile 1 | 40 |
| Minimum | 16 |
|
|
- There are 57 distinct values.
- Mean = 49.267
- Std.dev = 6.83179
- 5 items below graph minimum of 23
- 5 items above graph maximum of 74
- 447 items have value -1 (Do not know)
|
Notes
ACE touchscreen question "How old were you when you first used HRT?"
The following checks were performed:
- If answer < 16 then rejected
- If answer > Participants age then rejected
- If answer < 35 then participant asked to confirm
- If answer > 65 then participant asked to confirm
If the participant activated the Help button they were shown the message:
If you are unsure, please provide an estimate or select Do not know.
|
Field 3536 was collected from women who indicated that they had used HRT, as defined by their answers to Field 2814
Coding 100291 defines 2 special values:
- -1 represents "Do not know"
- -3 represents "Prefer not to answer"
1 Related Data-Field
| Field ID | Description | Relationship |
|---|
| 2814 | Ever used hormone-replacement therap ... | Current Field was collected from women who indicated that they had used HRT, as defined by their answers to Field 2814 |
4 Applications
| Application ID | Title |
|---|
| 26629 | Cross-cultural variations in female reproductive health and non-communicable diseases: analysis of 500,000 participants from the UKBiobank and the InterLACE consortium |
| 5791 | Development and validation of risk prediction model for breast and ovarian cancers |
| 17435 | Exploring the genetics of irritable bowel syndrome: the ?bellygenes? initiative (project approved by bbmri-lpc) |
| 871 | Genetic factors associated with being at different extremes of the reproductive lifespan |


