Data
507,960 items of data are available, covering 488,512 participants.
Defined-instances run from 0 to 1, labelled using Instancing
2.
Units of measurement are percent.
| Maximum | 72.4487 |
| Decile 9 | 65.401 |
| Decile 8 | 64.814 |
| Decile 7 | 64.3604 |
| Decile 6 | 63.942 |
| Median | 63.523 |
| Decile 4 | 63.0683 |
| Decile 3 | 62.5383 |
| Decile 2 | 61.8487 |
| Decile 1 | 60.7467 |
| Minimum | 7.41381e-11 |
|
|
- Mean = 63.2414
- Std.dev = 1.9921
- 2546 items below graph minimum of 56.0924
- 12 items above graph maximum of 70.0553
|
2 Instances
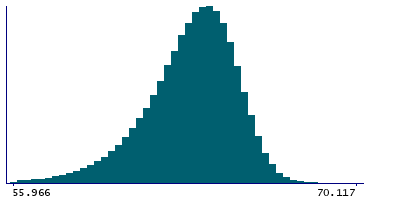
Instance 0 : Initial assessment visit (2006-2010) at which participants were recruited and consent given
488,083 participants, 488,083 items
| Maximum | 72.4487 |
| Decile 9 | 65.402 |
| Decile 8 | 64.8163 |
| Decile 7 | 64.3634 |
| Decile 6 | 63.946 |
| Median | 63.528 |
| Decile 4 | 63.075 |
| Decile 3 | 62.546 |
| Decile 2 | 61.8573 |
| Decile 1 | 60.758 |
| Minimum | 7.41381e-11 |
|

|
- Mean = 63.2463
- Std.dev = 1.99137
- 2481 items below graph minimum of 56.114
- 10 items above graph maximum of 70.046
|
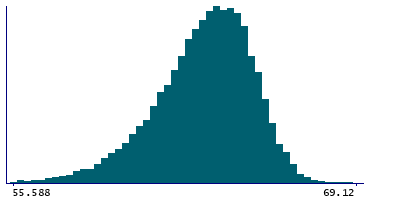
Instance 1 : First repeat assessment visit (2012-13)
19,877 participants, 19,877 items
| Maximum | 72.3268 |
| Decile 9 | 65.368 |
| Decile 8 | 64.747 |
| Decile 7 | 64.288 |
| Decile 6 | 63.838 |
| Median | 63.377 |
| Decile 4 | 62.894 |
| Decile 3 | 62.345 |
| Decile 2 | 61.6145 |
| Decile 1 | 60.505 |
| Minimum | 46.899 |
|
|
- Mean = 63.1196
- Std.dev = 2.006
- 71 items below graph minimum of 55.642
- 2 items above graph maximum of 70.231
|


