Data
507,901 items of data are available, covering 488,456 participants.
Defined-instances run from 0 to 1, labelled using Instancing
2.
Units of measurement are percent.
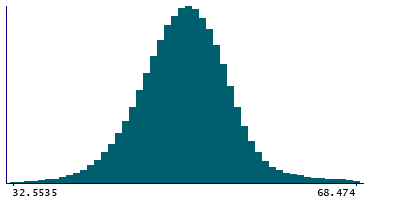
| Maximum | 99.1742 |
| Decile 9 | 56.4856 |
| Decile 8 | 54.419 |
| Decile 7 | 53.043 |
| Decile 6 | 51.8481 |
| Median | 50.713 |
| Decile 4 | 49.546 |
| Decile 3 | 48.256 |
| Decile 2 | 46.694 |
| Decile 1 | 44.394 |
| Minimum | 6.1735e-05 |
|
|
- Mean = 50.8145
- Std.dev = 6.03736
- 1537 items below graph minimum of 32.3024
- 7293 items above graph maximum of 68.5772
|
2 Instances
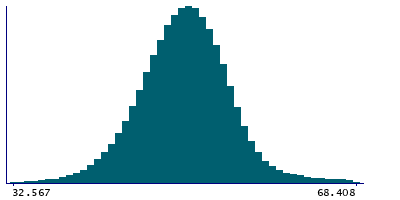
Instance 0 : Initial assessment visit (2006-2010) at which participants were recruited and consent given
488,026 participants, 488,026 items
| Maximum | 99.1742 |
| Decile 9 | 56.468 |
| Decile 8 | 54.4021 |
| Decile 7 | 53.0281 |
| Decile 6 | 51.837 |
| Median | 50.703 |
| Decile 4 | 49.536 |
| Decile 3 | 48.248 |
| Decile 2 | 46.685 |
| Decile 1 | 44.3883 |
| Minimum | 6.1735e-05 |
|
|
- Mean = 50.8028
- Std.dev = 6.03715
- 1491 items below graph minimum of 32.3087
- 7020 items above graph maximum of 68.5477
|
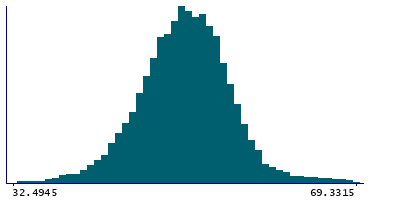
Instance 1 : First repeat assessment visit (2012-13)
19,875 participants, 19,875 items
| Maximum | 93.654 |
| Decile 9 | 56.9109 |
| Decile 8 | 54.764 |
| Decile 7 | 53.3942 |
| Decile 6 | 52.161 |
| Median | 50.9775 |
| Decile 4 | 49.798 |
| Decile 3 | 48.4465 |
| Decile 2 | 46.901 |
| Decile 1 | 44.533 |
| Minimum | 4.0103 |
|
|
- Mean = 51.1019
- Std.dev = 6.03531
- 47 items below graph minimum of 32.1551
- 265 items above graph maximum of 69.2887
|


