Data
507,960 items of data are available, covering 488,512 participants.
Defined-instances run from 0 to 1, labelled using Instancing
2.
Units of measurement are mmol/l.
| Maximum | 1.63521 |
| Decile 9 | 0.79875 |
| Decile 8 | 0.75059 |
| Decile 7 | 0.718334 |
| Decile 6 | 0.69245 |
| Median | 0.669022 |
| Decile 4 | 0.64648 |
| Decile 3 | 0.62318 |
| Decile 2 | 0.59677 |
| Decile 1 | 0.56137 |
| Minimum | 0.11989 |
|

|
- Mean = 0.675992
- Std.dev = 0.0962231
- 63 items below graph minimum of 0.32399
- 1162 items above graph maximum of 1.03613
|
2 Instances
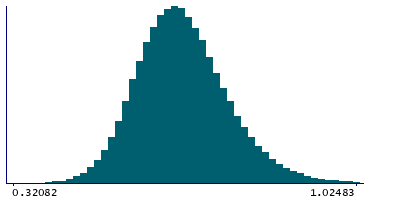
Instance 0 : Initial assessment visit (2006-2010) at which participants were recruited and consent given
488,083 participants, 488,083 items
| Maximum | 1.63521 |
| Decile 9 | 0.79893 |
| Decile 8 | 0.750725 |
| Decile 7 | 0.718437 |
| Decile 6 | 0.6925 |
| Median | 0.669072 |
| Decile 4 | 0.64652 |
| Decile 3 | 0.6232 |
| Decile 2 | 0.59678 |
| Decile 1 | 0.561366 |
| Minimum | 0.11989 |
|
|
- Mean = 0.676047
- Std.dev = 0.0962586
- 61 items below graph minimum of 0.323803
- 1104 items above graph maximum of 1.03649
|
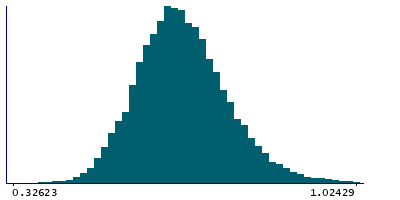
Instance 1 : First repeat assessment visit (2012-13)
19,877 participants, 19,877 items
| Maximum | 1.3954 |
| Decile 9 | 0.79518 |
| Decile 8 | 0.746945 |
| Decile 7 | 0.716085 |
| Decile 6 | 0.6915 |
| Median | 0.667905 |
| Decile 4 | 0.64557 |
| Decile 3 | 0.622658 |
| Decile 2 | 0.59648 |
| Decile 1 | 0.56153 |
| Minimum | 0.29943 |
|
|
- Mean = 0.674635
- Std.dev = 0.0953356
- 2 items below graph minimum of 0.32788
- 57 items above graph maximum of 1.02883
|


