Data
507,960 items of data are available, covering 488,512 participants.
Defined-instances run from 0 to 1, labelled using Instancing
2.
Units of measurement are mmol/l.
| Maximum | 0.335076 |
| Decile 9 | 0.1234 |
| Decile 8 | 0.11004 |
| Decile 7 | 0.10099 |
| Decile 6 | 0.09371 |
| Median | 0.087214 |
| Decile 4 | 0.0810775 |
| Decile 3 | 0.0748973 |
| Decile 2 | 0.0681597 |
| Decile 1 | 0.0595734 |
| Minimum | 1.9147e-07 |
|
|
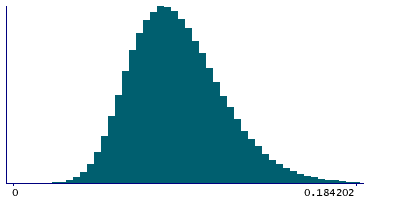
- Mean = 0.0897908
- Std.dev = 0.0254252
- 833 items above graph maximum of 0.187227
|
2 Instances
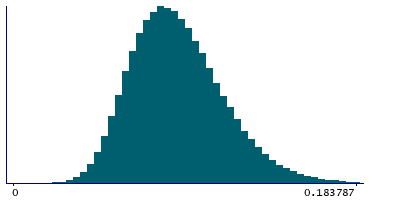
Instance 0 : Initial assessment visit (2006-2010) at which participants were recruited and consent given
488,083 participants, 488,083 items
| Maximum | 0.335076 |
| Decile 9 | 0.12328 |
| Decile 8 | 0.10991 |
| Decile 7 | 0.100862 |
| Decile 6 | 0.0935929 |
| Median | 0.0871103 |
| Decile 4 | 0.0809818 |
| Decile 3 | 0.074815 |
| Decile 2 | 0.06808 |
| Decile 1 | 0.0595052 |
| Minimum | 1.9147e-07 |
|
|
- Mean = 0.0896904
- Std.dev = 0.0254057
- 801 items above graph maximum of 0.187055
|
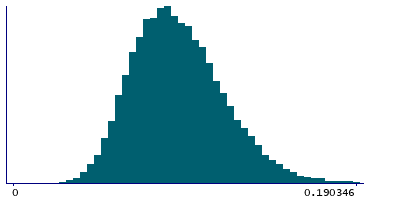
Instance 1 : First repeat assessment visit (2012-13)
19,877 participants, 19,877 items
| Maximum | 0.28689 |
| Decile 9 | 0.12624 |
| Decile 8 | 0.11279 |
| Decile 7 | 0.10399 |
| Decile 6 | 0.0965881 |
| Median | 0.089803 |
| Decile 4 | 0.0834865 |
| Decile 3 | 0.0770298 |
| Decile 2 | 0.0701619 |
| Decile 1 | 0.0614495 |
| Minimum | 0.013876 |
|
|
- Mean = 0.0922566
- Std.dev = 0.0257761
- 36 items above graph maximum of 0.19103
|


