Data
507,960 items of data are available, covering 488,512 participants.
Defined-instances run from 0 to 1, labelled using Instancing
2.
Units of measurement are mmol/l.
| Maximum | 1.71073 |
| Decile 9 | 0.676374 |
| Decile 8 | 0.61047 |
| Decile 7 | 0.565639 |
| Decile 6 | 0.528703 |
| Median | 0.49582 |
| Decile 4 | 0.464315 |
| Decile 3 | 0.43264 |
| Decile 2 | 0.398267 |
| Decile 1 | 0.35517 |
| Minimum | 3.1107e-07 |
|
|
- Mean = 0.507738
- Std.dev = 0.127144
- 652 items above graph maximum of 0.997577
|
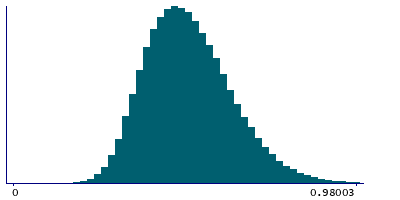
2 Instances
Instance 0 : Initial assessment visit (2006-2010) at which participants were recruited and consent given
488,083 participants, 488,083 items
| Maximum | 1.71073 |
| Decile 9 | 0.675899 |
| Decile 8 | 0.60996 |
| Decile 7 | 0.565049 |
| Decile 6 | 0.52812 |
| Median | 0.495245 |
| Decile 4 | 0.46377 |
| Decile 3 | 0.432129 |
| Decile 2 | 0.397772 |
| Decile 1 | 0.354645 |
| Minimum | 3.1107e-07 |
|

|
- Mean = 0.50721
- Std.dev = 0.127127
- 619 items above graph maximum of 0.997153
|
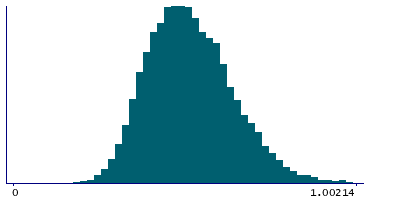
Instance 1 : First repeat assessment visit (2012-13)
19,877 participants, 19,877 items
| Maximum | 1.5086 |
| Decile 9 | 0.68786 |
| Decile 8 | 0.62183 |
| Decile 7 | 0.580225 |
| Decile 6 | 0.54277 |
| Median | 0.509428 |
| Decile 4 | 0.47805 |
| Decile 3 | 0.445608 |
| Decile 2 | 0.41106 |
| Decile 1 | 0.368085 |
| Minimum | 0.14053 |
|
|
- Mean = 0.520689
- Std.dev = 0.126861
- 36 items above graph maximum of 1.00764
|


