Data
507,960 items of data are available, covering 488,512 participants.
Defined-instances run from 0 to 1, labelled using Instancing
2.
Units of measurement are mmol/l.
| Maximum | 0.0081164 |
| Decile 9 | 0.00252077 |
| Decile 8 | 0.0020275 |
| Decile 7 | 0.00169997 |
| Decile 6 | 0.0014468 |
| Median | 0.00123923 |
| Decile 4 | 0.0010617 |
| Decile 3 | 0.0009033 |
| Decile 2 | 0.00075066 |
| Decile 1 | 0.0005788 |
| Minimum | 4.3723e-09 |
|
|
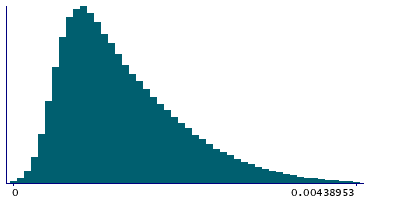
- Mean = 0.00141781
- Std.dev = 0.000790395
- 1296 items above graph maximum of 0.00446273
|
2 Instances
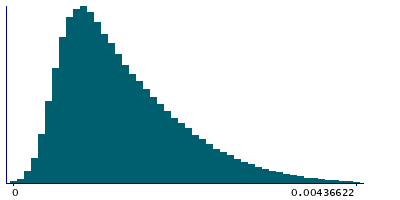
Instance 0 : Initial assessment visit (2006-2010) at which participants were recruited and consent given
488,083 participants, 488,083 items
| Maximum | 0.0081164 |
| Decile 9 | 0.00251286 |
| Decile 8 | 0.0020198 |
| Decile 7 | 0.001693 |
| Decile 6 | 0.0014407 |
| Median | 0.00123432 |
| Decile 4 | 0.0010574 |
| Decile 3 | 0.000900039 |
| Decile 2 | 0.00074804 |
| Decile 1 | 0.00057687 |
| Minimum | 4.3723e-09 |
|
|
- Mean = 0.00141275
- Std.dev = 0.000788251
- 1248 items above graph maximum of 0.00444885
|
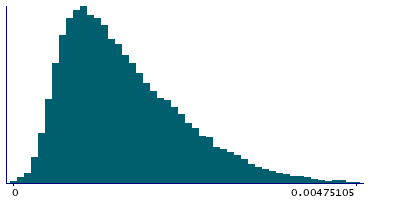
Instance 1 : First repeat assessment visit (2012-13)
19,877 participants, 19,877 items
| Maximum | 0.0066715 |
| Decile 9 | 0.0027037 |
| Decile 8 | 0.00220765 |
| Decile 7 | 0.0018636 |
| Decile 6 | 0.00159805 |
| Median | 0.0013678 |
| Decile 4 | 0.0011731 |
| Decile 3 | 0.0009952 |
| Decile 2 | 0.000824175 |
| Decile 1 | 0.000633088 |
| Minimum | 5.2494e-07 |
|
|
- Mean = 0.00154213
- Std.dev = 0.000831723
- 34 items above graph maximum of 0.00477432
|


