Data
507,960 items of data are available, covering 488,512 participants.
Defined-instances run from 0 to 1, labelled using Instancing
2.
Units of measurement are mmol/l.
| Maximum | 0.56242 |
| Decile 9 | 0.13936 |
| Decile 8 | 0.108936 |
| Decile 7 | 0.0902289 |
| Decile 6 | 0.076905 |
| Median | 0.066645 |
| Decile 4 | 0.0579259 |
| Decile 3 | 0.049807 |
| Decile 2 | 0.0411771 |
| Decile 1 | 0.0301539 |
| Minimum | 1.6484e-09 |
|

|
- Mean = 0.0771103
- Std.dev = 0.0459377
- 2541 items above graph maximum of 0.248566
|
2 Instances
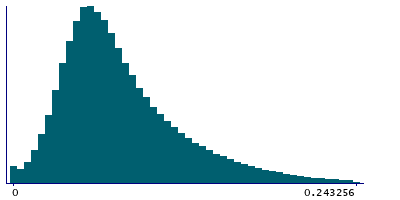
Instance 0 : Initial assessment visit (2006-2010) at which participants were recruited and consent given
488,083 participants, 488,083 items
| Maximum | 0.56242 |
| Decile 9 | 0.13868 |
| Decile 8 | 0.10843 |
| Decile 7 | 0.0897849 |
| Decile 6 | 0.076554 |
| Median | 0.0663748 |
| Decile 4 | 0.0576955 |
| Decile 3 | 0.0496109 |
| Decile 2 | 0.0410301 |
| Decile 1 | 0.030028 |
| Minimum | 6.4582e-09 |
|
|
- Mean = 0.0767762
- Std.dev = 0.0457558
- 2487 items above graph maximum of 0.247332
|
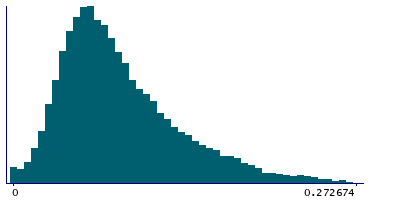
Instance 1 : First repeat assessment visit (2012-13)
19,877 participants, 19,877 items
| Maximum | 0.37209 |
| Decile 9 | 0.15451 |
| Decile 8 | 0.121455 |
| Decile 7 | 0.10148 |
| Decile 6 | 0.0861212 |
| Median | 0.0742295 |
| Decile 4 | 0.0641564 |
| Decile 3 | 0.055 |
| Decile 2 | 0.0454525 |
| Decile 1 | 0.0336258 |
| Minimum | 1.6484e-09 |
|
|
- Mean = 0.0853142
- Std.dev = 0.049496
- 70 items above graph maximum of 0.275394
|


