Data
507,960 items of data are available, covering 488,512 participants.
Defined-instances run from 0 to 1, labelled using Instancing
2.
Units of measurement are mmol/l.
| Maximum | 3.06618 |
| Decile 9 | 1.13462 |
| Decile 8 | 1.0281 |
| Decile 7 | 0.956314 |
| Decile 6 | 0.89673 |
| Median | 0.843164 |
| Decile 4 | 0.791399 |
| Decile 3 | 0.73719 |
| Decile 2 | 0.676525 |
| Decile 1 | 0.59556 |
| Minimum | 0 |
|
|
- Mean = 0.856543
- Std.dev = 0.214757
- 643 items above graph maximum of 1.67367
|
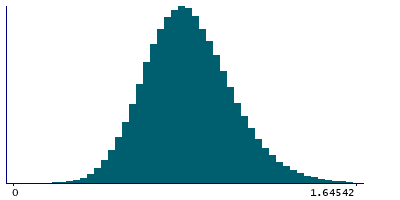
2 Instances
Instance 0 : Initial assessment visit (2006-2010) at which participants were recruited and consent given
488,083 participants, 488,083 items
| Maximum | 3.06618 |
| Decile 9 | 1.1352 |
| Decile 8 | 1.02865 |
| Decile 7 | 0.95685 |
| Decile 6 | 0.89729 |
| Median | 0.843761 |
| Decile 4 | 0.791949 |
| Decile 3 | 0.737774 |
| Decile 2 | 0.677222 |
| Decile 1 | 0.59642 |
| Minimum | 0 |
|

|
- Mean = 0.857144
- Std.dev = 0.214658
- 613 items above graph maximum of 1.67398
|
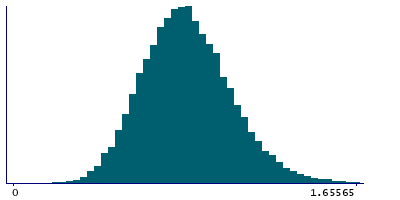
Instance 1 : First repeat assessment visit (2012-13)
19,877 participants, 19,877 items
| Maximum | 2.15024 |
| Decile 9 | 1.11995 |
| Decile 8 | 1.0135 |
| Decile 7 | 0.942948 |
| Decile 6 | 0.881869 |
| Median | 0.8297 |
| Decile 4 | 0.7778 |
| Decile 3 | 0.72305 |
| Decile 2 | 0.659275 |
| Decile 1 | 0.577435 |
| Minimum | 0.031688 |
|
|
- Mean = 0.841778
- Std.dev = 0.216635
- 30 items above graph maximum of 1.66247
|


