Data
507,960 items of data are available, covering 488,512 participants.
Defined-instances run from 0 to 1, labelled using Instancing
2.
Units of measurement are mmol/l.
| Maximum | 2.99148 |
| Decile 9 | 1.1271 |
| Decile 8 | 1.0252 |
| Decile 7 | 0.954409 |
| Decile 6 | 0.895647 |
| Median | 0.84105 |
| Decile 4 | 0.78744 |
| Decile 3 | 0.73019 |
| Decile 2 | 0.66401 |
| Decile 1 | 0.573181 |
| Minimum | 0.094424 |
|
|
- Mean = 0.848232
- Std.dev = 0.217995
- 467 items above graph maximum of 1.68102
|
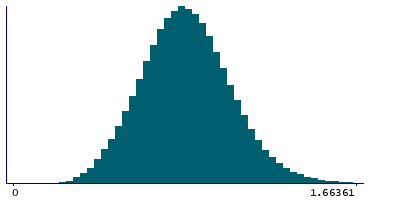
2 Instances
Instance 0 : Initial assessment visit (2006-2010) at which participants were recruited and consent given
488,083 participants, 488,083 items
| Maximum | 2.99148 |
| Decile 9 | 1.12721 |
| Decile 8 | 1.02535 |
| Decile 7 | 0.954607 |
| Decile 6 | 0.89578 |
| Median | 0.84132 |
| Decile 4 | 0.78794 |
| Decile 3 | 0.730825 |
| Decile 2 | 0.66475 |
| Decile 1 | 0.57417 |
| Minimum | 0.094424 |
|
|
- Mean = 0.848661
- Std.dev = 0.217697
- 443 items above graph maximum of 1.68025
|
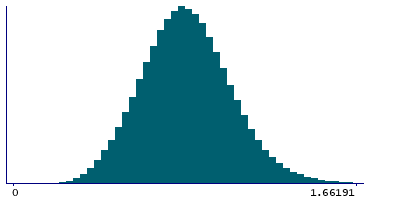
Instance 1 : First repeat assessment visit (2012-13)
19,877 participants, 19,877 items
| Maximum | 2.03979 |
| Decile 9 | 1.1233 |
| Decile 8 | 1.0204 |
| Decile 7 | 0.949535 |
| Decile 6 | 0.89206 |
| Median | 0.833395 |
| Decile 4 | 0.77516 |
| Decile 3 | 0.71569 |
| Decile 2 | 0.644664 |
| Decile 1 | 0.548105 |
| Minimum | 0.172989 |
|

|
- Mean = 0.837693
- Std.dev = 0.224925
- 24 items above graph maximum of 1.69849
|


