Data
507,960 items of data are available, covering 488,512 participants.
Defined-instances run from 0 to 1, labelled using Instancing
2.
Units of measurement are mmol/l.
| Maximum | 0.37356 |
| Decile 9 | 0.076197 |
| Decile 8 | 0.060665 |
| Decile 7 | 0.050115 |
| Decile 6 | 0.041712 |
| Median | 0.0344311 |
| Decile 4 | 0.0279004 |
| Decile 3 | 0.0218131 |
| Decile 2 | 0.015828 |
| Decile 1 | 0.0092147 |
| Minimum | 1.41474e-07 |
|

|
- Mean = 0.0394722
- Std.dev = 0.027218
- 1706 items above graph maximum of 0.143179
|
2 Instances
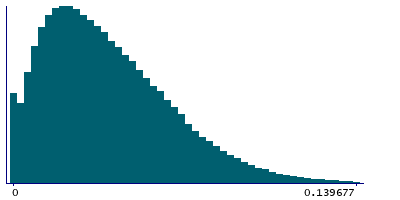
Instance 0 : Initial assessment visit (2006-2010) at which participants were recruited and consent given
488,083 participants, 488,083 items
| Maximum | 0.37356 |
| Decile 9 | 0.07635 |
| Decile 8 | 0.060799 |
| Decile 7 | 0.050219 |
| Decile 6 | 0.041792 |
| Median | 0.0344786 |
| Decile 4 | 0.027924 |
| Decile 3 | 0.0218203 |
| Decile 2 | 0.0158193 |
| Decile 1 | 0.0091964 |
| Minimum | 1.41474e-07 |
|
|
- Mean = 0.0395362
- Std.dev = 0.0272893
- 1643 items above graph maximum of 0.143504
|
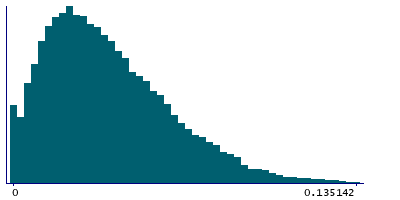
Instance 1 : First repeat assessment visit (2012-13)
19,877 participants, 19,877 items
| Maximum | 0.25943 |
| Decile 9 | 0.0721804 |
| Decile 8 | 0.0573971 |
| Decile 7 | 0.047861 |
| Decile 6 | 0.040016 |
| Median | 0.0333776 |
| Decile 4 | 0.0273775 |
| Decile 3 | 0.0216585 |
| Decile 2 | 0.0160855 |
| Decile 1 | 0.0096047 |
| Minimum | 7.149e-07 |
|
|
- Mean = 0.0378998
- Std.dev = 0.0253539
- 66 items above graph maximum of 0.134756
|


