Data
507,898 items of data are available, covering 488,454 participants.
Defined-instances run from 0 to 1, labelled using Instancing
2.
Units of measurement are mmol/l.
| Maximum | 0.303685 |
| Decile 9 | 0.075719 |
| Decile 8 | 0.0646044 |
| Decile 7 | 0.057998 |
| Decile 6 | 0.053093 |
| Median | 0.049051 |
| Decile 4 | 0.045365 |
| Decile 3 | 0.0417767 |
| Decile 2 | 0.0379074 |
| Decile 1 | 0.0330221 |
| Minimum | 0 |
|
|
- Mean = 0.0523596
- Std.dev = 0.0184228
- 3747 items above graph maximum of 0.118416
|
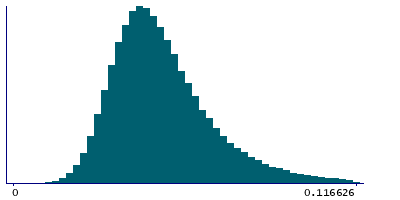
2 Instances
Instance 0 : Initial assessment visit (2006-2010) at which participants were recruited and consent given
488,022 participants, 488,022 items
| Maximum | 0.303685 |
| Decile 9 | 0.0758235 |
| Decile 8 | 0.064702 |
| Decile 7 | 0.0580867 |
| Decile 6 | 0.053175 |
| Median | 0.049127 |
| Decile 4 | 0.045432 |
| Decile 3 | 0.0418383 |
| Decile 2 | 0.0379688 |
| Decile 1 | 0.0330754 |
| Minimum | 0 |
|

|
- Mean = 0.0524331
- Std.dev = 0.0184302
- 3565 items above graph maximum of 0.118572
|
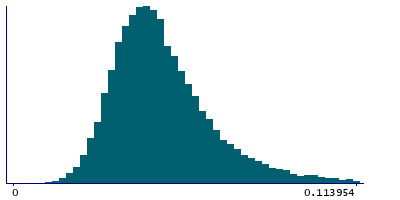
Instance 1 : First repeat assessment visit (2012-13)
19,876 participants, 19,876 items
| Maximum | 0.22583 |
| Decile 9 | 0.0730965 |
| Decile 8 | 0.0619505 |
| Decile 7 | 0.0557252 |
| Decile 6 | 0.05101 |
| Median | 0.047206 |
| Decile 4 | 0.0437886 |
| Decile 3 | 0.0403035 |
| Decile 2 | 0.0365805 |
| Decile 1 | 0.031865 |
| Minimum | 0.00024308 |
|
|
- Mean = 0.0505553
- Std.dev = 0.0181483
- 182 items above graph maximum of 0.114328
|


