Data
507,760 items of data are available, covering 488,325 participants.
Defined-instances run from 0 to 1, labelled using Instancing
2.
Units of measurement are mmol/l.
| Maximum | 1.49513 |
| Decile 9 | 0.405886 |
| Decile 8 | 0.364632 |
| Decile 7 | 0.33682 |
| Decile 6 | 0.314068 |
| Median | 0.293985 |
| Decile 4 | 0.27493 |
| Decile 3 | 0.25584 |
| Decile 2 | 0.235092 |
| Decile 1 | 0.20924 |
| Minimum | 0.061282 |
|
|
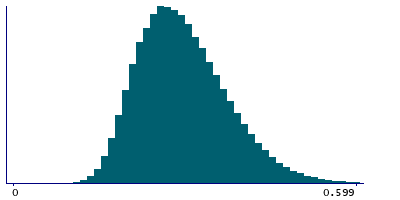
- Mean = 0.302323
- Std.dev = 0.0781668
- 879 items above graph maximum of 0.602533
|
2 Instances
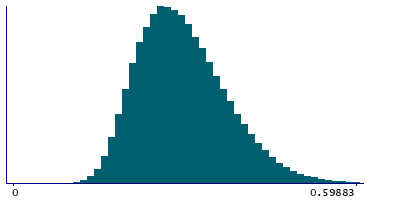
Instance 0 : Initial assessment visit (2006-2010) at which participants were recruited and consent given
487,885 participants, 487,885 items
| Maximum | 1.49513 |
| Decile 9 | 0.40599 |
| Decile 8 | 0.36475 |
| Decile 7 | 0.33692 |
| Decile 6 | 0.314154 |
| Median | 0.29408 |
| Decile 4 | 0.275016 |
| Decile 3 | 0.2559 |
| Decile 2 | 0.235123 |
| Decile 1 | 0.20924 |
| Minimum | 0.061282 |
|
|
- Mean = 0.302396
- Std.dev = 0.0782163
- 847 items above graph maximum of 0.60274
|
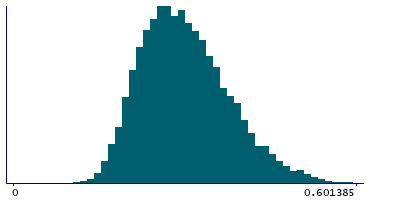
Instance 1 : First repeat assessment visit (2012-13)
19,875 participants, 19,875 items
| Maximum | 0.7517 |
| Decile 9 | 0.402985 |
| Decile 8 | 0.36161 |
| Decile 7 | 0.33418 |
| Decile 6 | 0.311834 |
| Median | 0.292133 |
| Decile 4 | 0.273061 |
| Decile 3 | 0.25438 |
| Decile 2 | 0.23438 |
| Decile 1 | 0.209405 |
| Minimum | 0.072015 |
|
|
- Mean = 0.300541
- Std.dev = 0.0769207
- 33 items above graph maximum of 0.596565
|


