Data
572,355 items of data are available, covering 492,392 participants.
Defined-instances run from 0 to 3, labelled using Instancing
2.
Units of measurement are Kg.
| Maximum | 32.7 |
| Decile 9 | 3.9 |
| Decile 8 | 3.5 |
| Decile 7 | 3.2 |
| Decile 6 | 2.9 |
| Median | 2.5 |
| Decile 4 | 2.3 |
| Decile 3 | 2.1 |
| Decile 2 | 2 |
| Decile 1 | 1.9 |
| Minimum | 0.8 |
|
|
- Mean = 2.73727
- Std.dev = 0.793271
- 111 items above graph maximum of 5.9
|
4 Instances
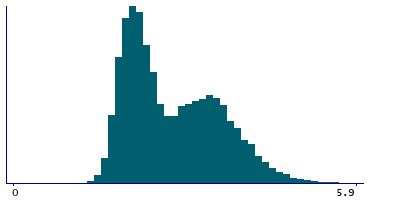
Instance 0 : Initial assessment visit (2006-2010) at which participants were recruited and consent given
491,561 participants, 491,561 items
| Maximum | 32.7 |
| Decile 9 | 3.9 |
| Decile 8 | 3.5 |
| Decile 7 | 3.2 |
| Decile 6 | 2.9 |
| Median | 2.5 |
| Decile 4 | 2.3 |
| Decile 3 | 2.1 |
| Decile 2 | 2 |
| Decile 1 | 1.9 |
| Minimum | 0.8 |
|

|
- Mean = 2.7402
- Std.dev = 0.79783
- 96 items above graph maximum of 5.9
|
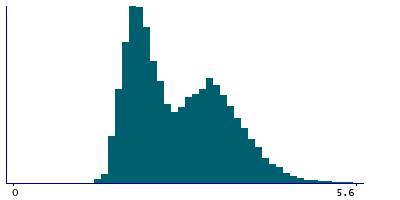
Instance 1 : First repeat assessment visit (2012-13)
20,022 participants, 20,022 items
| Maximum | 6.5 |
| Decile 9 | 3.7 |
| Decile 8 | 3.4 |
| Decile 7 | 3.1 |
| Decile 6 | 2.9 |
| Median | 2.6 |
| Decile 4 | 2.3 |
| Decile 3 | 2.1 |
| Decile 2 | 2 |
| Decile 1 | 1.8 |
| Minimum | 1.2 |
|
|
- Mean = 2.69393
- Std.dev = 0.753299
- 7 items above graph maximum of 5.6
|
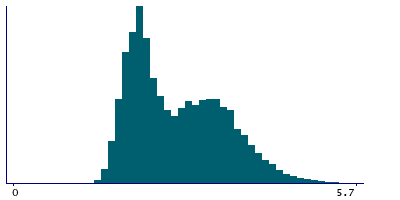
Instance 2 : Imaging visit (2014+)
55,607 participants, 55,607 items
| Maximum | 6.6 |
| Decile 9 | 3.8 |
| Decile 8 | 3.4 |
| Decile 7 | 3.2 |
| Decile 6 | 2.9 |
| Median | 2.6 |
| Decile 4 | 2.3 |
| Decile 3 | 2.1 |
| Decile 2 | 2 |
| Decile 1 | 1.9 |
| Minimum | 1.2 |
|
|
- Mean = 2.72854
- Std.dev = 0.768513
- 33 items above graph maximum of 5.7
|
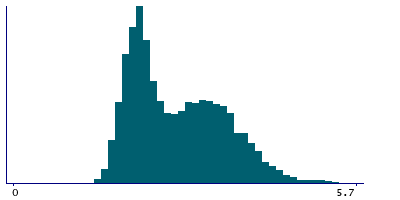
Instance 3 : First repeat imaging visit (2019+)
5,165 participants, 5,165 items
| Maximum | 6.3 |
| Decile 9 | 3.8 |
| Decile 8 | 3.4 |
| Decile 7 | 3.2 |
| Decile 6 | 2.9 |
| Median | 2.6 |
| Decile 4 | 2.3 |
| Decile 3 | 2.1 |
| Decile 2 | 2 |
| Decile 1 | 1.9 |
| Minimum | 1.3 |
|
|
- Mean = 2.72083
- Std.dev = 0.765318
- 3 items above graph maximum of 5.7
|


