Data
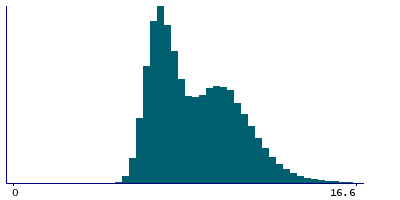
572,519 items of data are available, covering 492,532 participants.
Defined-instances run from 0 to 3, labelled using Instancing
2.
Units of measurement are Kg.
| Maximum | 24.2 |
| Decile 9 | 11.6 |
| Decile 8 | 10.6 |
| Decile 7 | 9.9 |
| Decile 6 | 9.2 |
| Median | 8.4 |
| Decile 4 | 7.8 |
| Decile 3 | 7.4 |
| Decile 2 | 7 |
| Decile 1 | 6.6 |
| Minimum | 0.7 |
|
|
- Mean = 8.82248
- Std.dev = 1.99863
- 655 items above graph maximum of 16.6
|
4 Instances
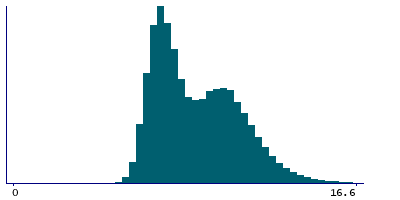
Instance 0 : Initial assessment visit (2006-2010) at which participants were recruited and consent given
491,725 participants, 491,725 items
| Maximum | 24.2 |
| Decile 9 | 11.6 |
| Decile 8 | 10.7 |
| Decile 7 | 10 |
| Decile 6 | 9.3 |
| Median | 8.5 |
| Decile 4 | 7.8 |
| Decile 3 | 7.4 |
| Decile 2 | 7 |
| Decile 1 | 6.6 |
| Minimum | 0.7 |
|
|
- Mean = 8.86665
- Std.dev = 2.01076
- 594 items above graph maximum of 16.6
|
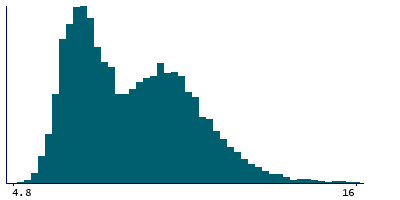
Instance 1 : First repeat assessment visit (2012-13)
20,022 participants, 20,022 items
| Maximum | 19.7 |
| Decile 9 | 11.25 |
| Decile 8 | 10.4 |
| Decile 7 | 9.8 |
| Decile 6 | 9.1 |
| Median | 8.4 |
| Decile 4 | 7.8 |
| Decile 3 | 7.3 |
| Decile 2 | 6.9 |
| Decile 1 | 6.5 |
| Minimum | 4.8 |
|
|
- Mean = 8.69738
- Std.dev = 1.9101
- 32 items above graph maximum of 16
|
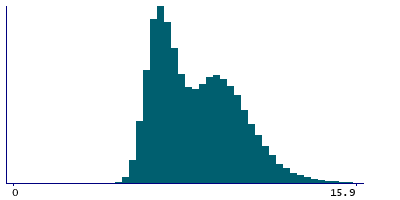
Instance 2 : Imaging visit (2014+)
55,607 participants, 55,607 items
| Maximum | 19 |
| Decile 9 | 11.1 |
| Decile 8 | 10.2 |
| Decile 7 | 9.5 |
| Decile 6 | 8.9 |
| Median | 8.2 |
| Decile 4 | 7.6 |
| Decile 3 | 7.1 |
| Decile 2 | 6.7 |
| Decile 1 | 6.3 |
| Minimum | 4.7 |
|
|
- Mean = 8.51167
- Std.dev = 1.89848
- 75 items above graph maximum of 15.9
|
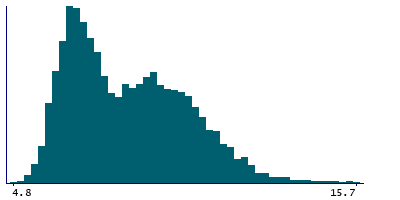
Instance 3 : First repeat imaging visit (2019+)
5,165 participants, 5,165 items
| Maximum | 17.6 |
| Decile 9 | 11 |
| Decile 8 | 10.2 |
| Decile 7 | 9.4 |
| Decile 6 | 8.9 |
| Median | 8.2 |
| Decile 4 | 7.5 |
| Decile 3 | 7.1 |
| Decile 2 | 6.7 |
| Decile 1 | 6.3 |
| Minimum | 4.8 |
|
|
- Mean = 8.44838
- Std.dev = 1.86641
- 5 items above graph maximum of 15.7
|
Notes
Body composition estimation by impedance measurement. Left leg fat free mass.
Left leg fat free mass in Kg, 0.1 increments.


