Data
572,554 items of data are available, covering 492,560 participants.
Defined-instances run from 0 to 3, labelled using Instancing
2.
Units of measurement are Kg.
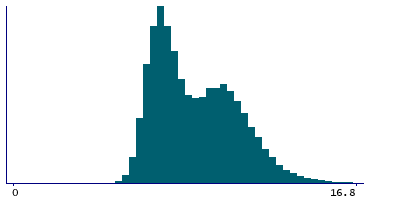
| Maximum | 24.4 |
| Decile 9 | 11.7 |
| Decile 8 | 10.7 |
| Decile 7 | 10 |
| Decile 6 | 9.3 |
| Median | 8.5 |
| Decile 4 | 7.9 |
| Decile 3 | 7.4 |
| Decile 2 | 7.1 |
| Decile 1 | 6.6 |
| Minimum | 1.8 |
|
|
- Mean = 8.92208
- Std.dev = 2.01266
- 614 items above graph maximum of 16.8
|
4 Instances
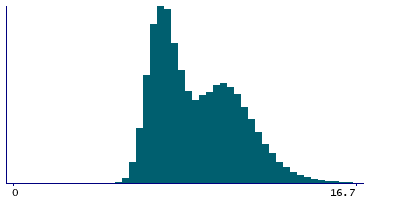
Instance 0 : Initial assessment visit (2006-2010) at which participants were recruited and consent given
491,760 participants, 491,760 items
| Maximum | 24.4 |
| Decile 9 | 11.7 |
| Decile 8 | 10.8 |
| Decile 7 | 10.1 |
| Decile 6 | 9.4 |
| Median | 8.6 |
| Decile 4 | 7.9 |
| Decile 3 | 7.5 |
| Decile 2 | 7.1 |
| Decile 1 | 6.7 |
| Minimum | 1.8 |
|
|
- Mean = 8.96989
- Std.dev = 2.02473
- 555 items above graph maximum of 16.7
|
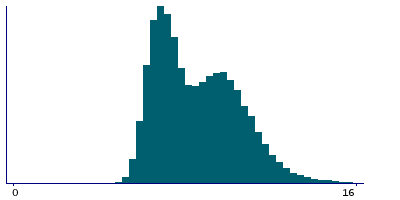
Instance 1 : First repeat assessment visit (2012-13)
20,022 participants, 20,022 items
| Maximum | 20 |
| Decile 9 | 11.4 |
| Decile 8 | 10.5 |
| Decile 7 | 9.9 |
| Decile 6 | 9.3 |
| Median | 8.5 |
| Decile 4 | 7.9 |
| Decile 3 | 7.4 |
| Decile 2 | 7 |
| Decile 1 | 6.6 |
| Minimum | 4.5 |
|
|
- Mean = 8.79209
- Std.dev = 1.91858
- 29 items above graph maximum of 16.2
|
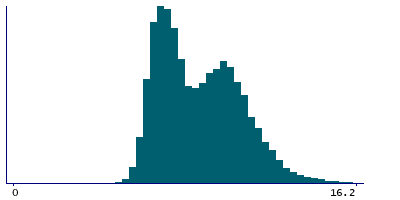
Instance 2 : Imaging visit (2014+)
55,607 participants, 55,607 items
| Maximum | 20.5 |
| Decile 9 | 11.2 |
| Decile 8 | 10.3 |
| Decile 7 | 9.6 |
| Decile 6 | 9 |
| Median | 8.3 |
| Decile 4 | 7.6 |
| Decile 3 | 7.2 |
| Decile 2 | 6.8 |
| Decile 1 | 6.4 |
| Minimum | 4.7 |
|
|
- Mean = 8.58437
- Std.dev = 1.90939
- 73 items above graph maximum of 16
|
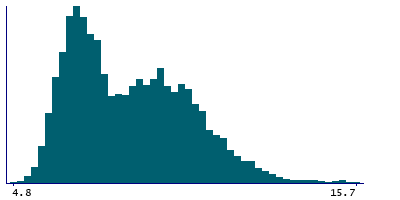
Instance 3 : First repeat imaging visit (2019+)
5,165 participants, 5,165 items
| Maximum | 18.1 |
| Decile 9 | 11 |
| Decile 8 | 10.2 |
| Decile 7 | 9.5 |
| Decile 6 | 8.9 |
| Median | 8.2 |
| Decile 4 | 7.6 |
| Decile 3 | 7.1 |
| Decile 2 | 6.8 |
| Decile 1 | 6.3 |
| Minimum | 4.8 |
|
|
- Mean = 8.50972
- Std.dev = 1.87657
- 6 items above graph maximum of 15.7
|
Notes
Body composition estimation by impedance measurement. Right leg fat free mass.
Right leg fat free mass in Kg, 0.1 increments.


