Data
572,550 items of data are available, covering 492,557 participants.
Defined-instances run from 0 to 3, labelled using Instancing
2.
Units of measurement are ohms.
| Maximum | 999 |
| Decile 9 | 720 |
| Decile 8 | 680 |
| Decile 7 | 650 |
| Decile 6 | 622 |
| Median | 596 |
| Decile 4 | 571 |
| Decile 3 | 546 |
| Decile 2 | 521 |
| Decile 1 | 490 |
| Minimum | 51 |
|

|
- Mean = 601.002
- Std.dev = 89.1586
- 129 items below graph minimum of 260
- 98 items above graph maximum of 950
|
4 Instances
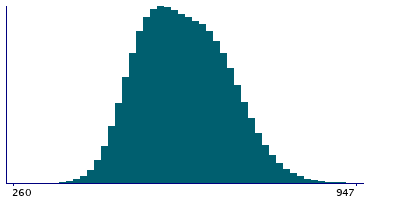
Instance 0 : Initial assessment visit (2006-2010) at which participants were recruited and consent given
491,761 participants, 491,761 items
| Maximum | 998 |
| Decile 9 | 718 |
| Decile 8 | 679 |
| Decile 7 | 649 |
| Decile 6 | 621 |
| Median | 595 |
| Decile 4 | 570 |
| Decile 3 | 546 |
| Decile 2 | 520 |
| Decile 1 | 489 |
| Minimum | 51 |
|
|
- Mean = 600.107
- Std.dev = 88.9691
- 114 items below graph minimum of 260
- 89 items above graph maximum of 947
|
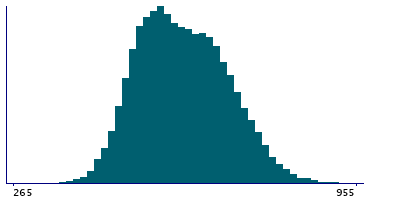
Instance 1 : First repeat assessment visit (2012-13)
20,019 participants, 20,019 items
| Maximum | 969 |
| Decile 9 | 725 |
| Decile 8 | 684 |
| Decile 7 | 654 |
| Decile 6 | 626 |
| Median | 599 |
| Decile 4 | 573 |
| Decile 3 | 549 |
| Decile 2 | 524 |
| Decile 1 | 495 |
| Minimum | 189 |
|
|
- Mean = 604.977
- Std.dev = 89.2223
- 4 items below graph minimum of 265
- 2 items above graph maximum of 955
|
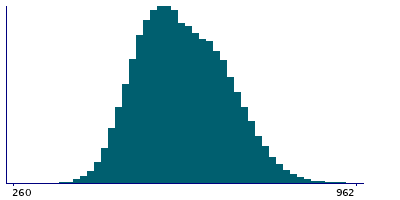
Instance 2 : Imaging visit (2014+)
55,605 participants, 55,605 items
| Maximum | 999 |
| Decile 9 | 728 |
| Decile 8 | 687 |
| Decile 7 | 655 |
| Decile 6 | 626 |
| Median | 599 |
| Decile 4 | 575 |
| Decile 3 | 551 |
| Decile 2 | 526 |
| Decile 1 | 494 |
| Minimum | 53 |
|
|
- Mean = 606.261
- Std.dev = 90.2428
- 11 items below graph minimum of 260
- 7 items above graph maximum of 962
|
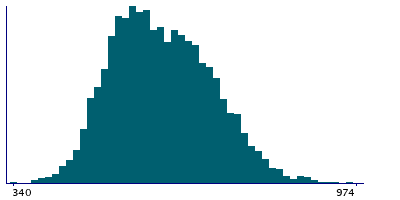
Instance 3 : First repeat imaging visit (2019+)
5,165 participants, 5,165 items
| Maximum | 985 |
| Decile 9 | 737 |
| Decile 8 | 696 |
| Decile 7 | 664 |
| Decile 6 | 636 |
| Median | 607 |
| Decile 4 | 581 |
| Decile 3 | 557 |
| Decile 2 | 533 |
| Decile 1 | 501 |
| Minimum | 340 |
|
|
- Mean = 614.25
- Std.dev = 91.7307
- 1 item above graph maximum of 973
|


