Data
90,346 items of data are available, covering 54,054 participants.
Defined-instances run from 0 to 3, labelled using Instancing
2.
Array indices run from 0 to 1.
Units of measurement are mmHg.
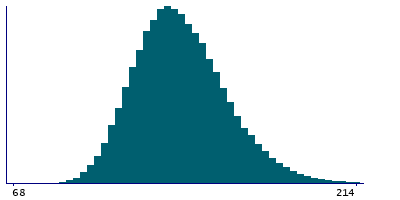
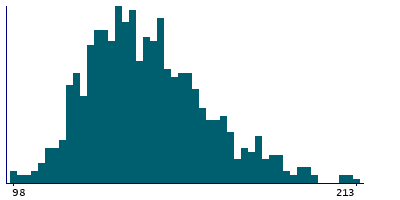
| Maximum | 250 |
| Decile 9 | 165 |
| Decile 8 | 155 |
| Decile 7 | 148 |
| Decile 6 | 143 |
| Median | 138 |
| Decile 4 | 133 |
| Decile 3 | 128 |
| Decile 2 | 123 |
| Decile 1 | 116 |
| Minimum | 68 |
|
|
- There are 162 distinct values.
- Mean = 139.413
- Std.dev = 19.5546
- 89 items above graph maximum of 214
|
4 Instances
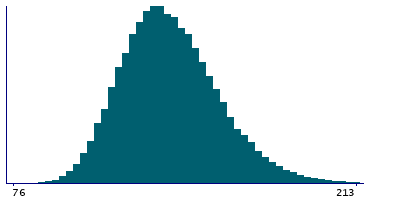
Instance 0 : Initial assessment visit (2006-2010) at which participants were recruited and consent given
43,760 participants, 72,431 items
| Maximum | 250 |
| Decile 9 | 164 |
| Decile 8 | 154 |
| Decile 7 | 148 |
| Decile 6 | 142 |
| Median | 137 |
| Decile 4 | 132 |
| Decile 3 | 128 |
| Decile 2 | 122 |
| Decile 1 | 115 |
| Minimum | 76 |
|
|
- There are 161 distinct values.
- Mean = 138.703
- Std.dev = 19.3816
- 79 items above graph maximum of 213
|
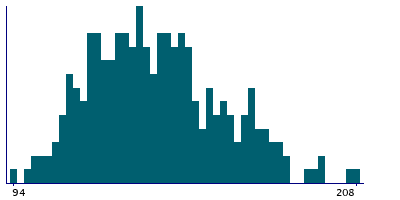
Instance 1 : First repeat assessment visit (2012-13)
219 participants, 262 items
| Maximum | 208 |
| Decile 9 | 172.5 |
| Decile 8 | 160 |
| Decile 7 | 151.5 |
| Decile 6 | 145 |
| Median | 140 |
| Decile 4 | 134 |
| Decile 3 | 128 |
| Decile 2 | 122 |
| Decile 1 | 114 |
| Minimum | 94 |
|
|
- There are 85 distinct values.
- Mean = 141.645
- Std.dev = 21.8274
|
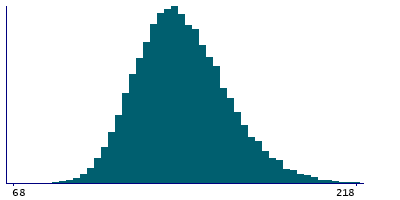
Instance 2 : Imaging visit (2014+)
10,023 participants, 15,838 items
| Maximum | 238 |
| Decile 9 | 169 |
| Decile 8 | 158 |
| Decile 7 | 151 |
| Decile 6 | 146 |
| Median | 140 |
| Decile 4 | 136 |
| Decile 3 | 131 |
| Decile 2 | 125 |
| Decile 1 | 118 |
| Minimum | 68 |
|
|
- There are 141 distinct values.
- Mean = 142.044
- Std.dev = 19.9673
- 8 items above graph maximum of 220
|
Instance 3 : First repeat imaging visit (2019+)
1,224 participants, 1,815 items
| Maximum | 214 |
| Decile 9 | 170 |
| Decile 8 | 161 |
| Decile 7 | 154 |
| Decile 6 | 148 |
| Median | 143 |
| Decile 4 | 138 |
| Decile 3 | 133 |
| Decile 2 | 127 |
| Decile 1 | 120 |
| Minimum | 87 |
|
|
- There are 111 distinct values.
- Mean = 144.493
- Std.dev = 19.7036
|


