Data
305,848 items of data are available, covering 268,623 participants.
Some values have special meanings defined by Data-Coding
100300.
Defined-instances run from 0 to 3, labelled using Instancing
2.
Units of measurement are miles.
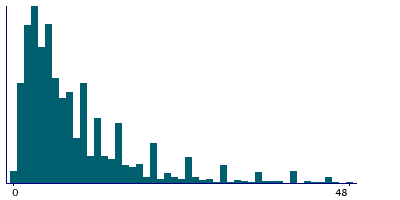
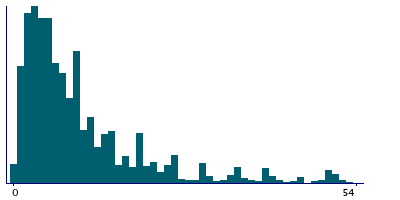
| Maximum | 9000 |
| Decile 9 | 25 |
| Decile 8 | 15 |
| Decile 7 | 10 |
| Decile 6 | 8 |
| Median | 6 |
| Decile 4 | 5 |
| Decile 3 | 4 |
| Decile 2 | 3 |
| Decile 1 | 2 |
| Minimum | 0 |
|
|
- There are 331 distinct values.
- Mean = 14.0317
- Std.dev = 83.3835
- 10229 items above graph maximum of 48
- 12308 items have value -10 (Less than one mile)
- 2459 items have value -3 (Prefer not to answer)
- 15783 items have value -1 (Do not know)
|
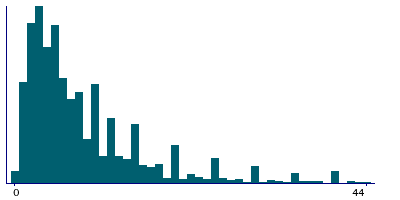
4 Instances
Instance 0 : Initial assessment visit (2006-2010) at which participants were recruited and consent given
265,267 participants, 265,267 items
| Maximum | 9000 |
| Decile 9 | 23 |
| Decile 8 | 15 |
| Decile 7 | 10 |
| Decile 6 | 8 |
| Median | 6 |
| Decile 4 | 5 |
| Decile 3 | 4 |
| Decile 2 | 3 |
| Decile 1 | 2 |
| Minimum | 0 |
|
|
- There are 308 distinct values.
- Mean = 13.8189
- Std.dev = 86.7417
- 9580 items above graph maximum of 44
- 10852 items have value -10 (Less than one mile)
- 2060 items have value -3 (Prefer not to answer)
- 13924 items have value -1 (Do not know)
|
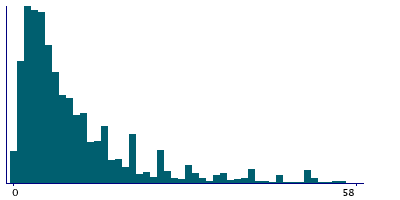
Instance 1 : First repeat assessment visit (2012-13)
7,468 participants, 7,468 items
| Maximum | 800 |
| Decile 9 | 28 |
| Decile 8 | 16 |
| Decile 7 | 12 |
| Decile 6 | 9 |
| Median | 7 |
| Decile 4 | 5 |
| Decile 3 | 4 |
| Decile 2 | 3 |
| Decile 1 | 2 |
| Minimum | 0 |
|
|
- There are 118 distinct values.
- Mean = 14.1522
- Std.dev = 29.3735
- 222 items above graph maximum of 54
- 271 items have value -10 (Less than one mile)
- 80 items have value -3 (Prefer not to answer)
- 318 items have value -1 (Do not know)
|
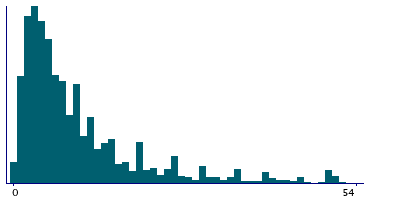
Instance 2 : Imaging visit (2014+)
28,556 participants, 28,556 items
| Maximum | 6830 |
| Decile 9 | 30 |
| Decile 8 | 17 |
| Decile 7 | 12 |
| Decile 6 | 10 |
| Median | 7 |
| Decile 4 | 5 |
| Decile 3 | 4 |
| Decile 2 | 3 |
| Decile 1 | 2 |
| Minimum | 0 |
|
|
- There are 196 distinct values.
- Mean = 15.8579
- Std.dev = 64.7773
- 997 items above graph maximum of 58
- 1037 items have value -10 (Less than one mile)
- 282 items have value -3 (Prefer not to answer)
- 1353 items have value -1 (Do not know)
|
Instance 3 : First repeat imaging visit (2019+)
4,557 participants, 4,557 items
| Maximum | 1000 |
| Decile 9 | 25 |
| Decile 8 | 16 |
| Decile 7 | 12 |
| Decile 6 | 10 |
| Median | 7 |
| Decile 4 | 5 |
| Decile 3 | 4 |
| Decile 2 | 3 |
| Decile 1 | 2 |
| Minimum | 0 |
|
|
- There are 106 distinct values.
- Mean = 14.6609
- Std.dev = 36.3731
- 183 items above graph maximum of 48
- 148 items have value -10 (Less than one mile)
- 37 items have value -3 (Prefer not to answer)
- 188 items have value -1 (Do not know)
|
Notes
ACE touchscreen question "About how many miles is it between your home and your work? "
The following checks were performed:
- If answer < 0 then rejected
- If answer > 9999 then rejected
- If answer > 70 then participant asked to confirm
If the participant activated the Help button they were shown the message:
If you have more than one 'current job' then answer this question for your
MAIN job only.
If you are unsure, please provide an estimate or select Do not know.
If you only work from home please enter 0
|
Field 796 was collected from participants who indicated they were in paid employment or self-employed, as defined by their answers to Field 6142 and except those who indicated they always work from home, as defined by their answers to Field 6142
Coding 100300 defines 3 special values:
- -10 represents "Less than one mile"
- -1 represents "Do not know"
- -3 represents "Prefer not to answer"
2 Related Data-Fields
| Field ID | Description | Relationship |
|---|
| 6142 | Current employment status | Field 6142 affects who was asked to answer Current Field |
| 777 | Frequency of travelling from home to ... | Field 777 affects who was asked to answer Current Field |
1 Application
| Application ID | Title |
|---|
| 20684 | Understanding the associations between environmental exposures, health behaviours and health outcomes |


