Data
102,191 items of data are available, covering 88,768 participants.
Some values have special meanings defined by Data-Coding
1990.
Defined-instances run from 2 to 3, labelled using Instancing
2.
Units of measurement are deciseconds.
| Maximum | 2557 |
| Decile 9 | 325 |
| Decile 8 | 279 |
| Decile 7 | 253 |
| Decile 6 | 234 |
| Median | 218 |
| Decile 4 | 205 |
| Decile 3 | 192 |
| Decile 2 | 178 |
| Decile 1 | 162 |
| Minimum | 92 |
|

|
- There are 878 distinct values.
- Mean = 237.127
- Std.dev = 88.8841
- 1758 items above graph maximum of 488
- 906 items have value 0 (Trail not completed)
|
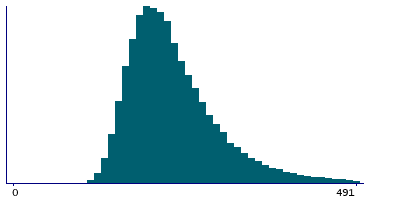
2 Instances
Instance 2 : Imaging visit (2014+)
82,252 participants, 82,252 items
| Maximum | 2456 |
| Decile 9 | 325 |
| Decile 8 | 279 |
| Decile 7 | 253 |
| Decile 6 | 234 |
| Median | 219 |
| Decile 4 | 205 |
| Decile 3 | 192 |
| Decile 2 | 178 |
| Decile 1 | 162 |
| Minimum | 92 |
|
|
- There are 844 distinct values.
- Mean = 237.361
- Std.dev = 89.1698
- 1426 items above graph maximum of 488
- 726 items have value 0 (Trail not completed)
|
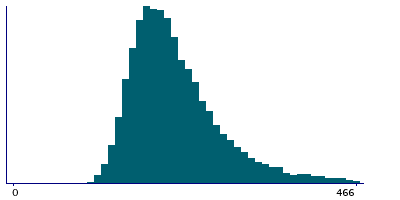
Instance 3 : First repeat imaging visit (2019+)
19,939 participants, 19,939 items
| Maximum | 2557 |
| Decile 9 | 325 |
| Decile 8 | 278 |
| Decile 7 | 251 |
| Decile 6 | 233 |
| Median | 217 |
| Decile 4 | 204 |
| Decile 3 | 191 |
| Decile 2 | 178 |
| Decile 1 | 162 |
| Minimum | 104 |
|
|
- There are 592 distinct values.
- Mean = 236.163
- Std.dev = 87.6886
- 332 items above graph maximum of 488
- 180 items have value 0 (Trail not completed)
|