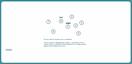
Data
279,100 items of data are available, covering 201,870 participants.
Defined-instances run from 0 to 1, labelled using Instancing
178.
Units of measurement are seconds.
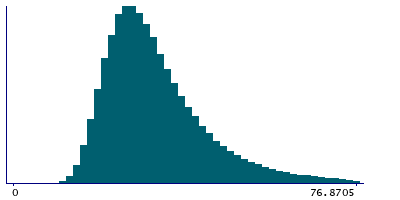
| Maximum | 733.97 |
| Decile 9 | 48.45 |
| Decile 8 | 40.3 |
| Decile 7 | 35.659 |
| Decile 6 | 32.344 |
| Median | 29.69 |
| Decile 4 | 27.343 |
| Decile 3 | 25.116 |
| Decile 2 | 22.831 |
| Decile 1 | 20.023 |
| Minimum | 7.863 |
|
|
- Mean = 32.6474
- Std.dev = 13.362
- 3389 items above graph maximum of 76.877
|
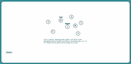
2 Instances
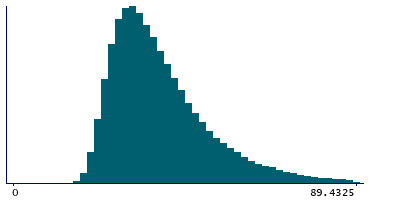
Instance 0 : Assessment run 2014
103,894 participants, 103,894 items
| Maximum | 733.97 |
| Decile 9 | 57.2745 |
| Decile 8 | 48.0445 |
| Decile 7 | 42.701 |
| Decile 6 | 38.8445 |
| Median | 35.698 |
| Decile 4 | 32.9645 |
| Decile 3 | 30.464 |
| Decile 2 | 27.96 |
| Decile 1 | 25.11 |
| Minimum | 13.666 |
|
|
- Mean = 39.1972
- Std.dev = 15.0017
- 1238 items above graph maximum of 89.439
|
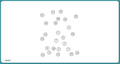
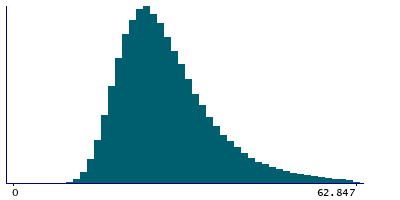
Instance 1 : Assessment run 2021
175,206 participants, 175,206 items
| Maximum | 306.905 |
| Decile 9 | 40.7595 |
| Decile 8 | 34.796 |
| Decile 7 | 31.343 |
| Decile 6 | 28.794 |
| Median | 26.686 |
| Decile 4 | 24.773 |
| Decile 3 | 22.968 |
| Decile 2 | 21.018 |
| Decile 1 | 18.659 |
| Minimum | 7.863 |
|
|
- Mean = 28.7635
- Std.dev = 10.5092
- 2218 items above graph maximum of 62.86
|
Notes
Derived by summing the values in
Field 20149.
Where some of the individual timings were flagged as Invalid, the total duration was calculated by interpolating from the valid timings.