Data
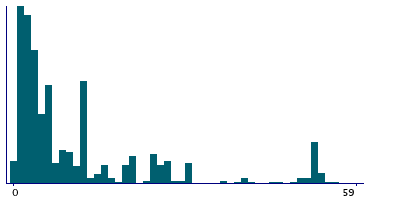
102,130 items of data are available, covering 88,069 participants.
Some values have special meanings defined by Data-Coding
100291.
Defined-instances run from 0 to 3, labelled using Instancing
2.
Units of measurement are weeks.
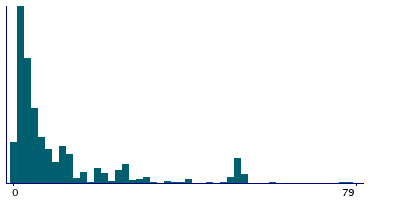
| Maximum | 999 |
| Decile 9 | 40 |
| Decile 8 | 20 |
| Decile 7 | 12 |
| Decile 6 | 6 |
| Median | 4 |
| Decile 4 | 4 |
| Decile 3 | 2 |
| Decile 2 | 2 |
| Decile 1 | 1 |
| Minimum | 1 |
|
|
- There are 190 distinct values.
- Mean = 15.9023
- Std.dev = 43.0558
- 2564 items above graph maximum of 79
- 1426 items have value -3 (Prefer not to answer)
- 22542 items have value -1 (Do not know)
|
4 Instances
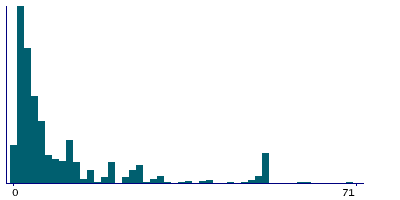
Instance 0 : Initial assessment visit (2006-2010) at which participants were recruited and consent given
60,474 participants, 60,474 items
| Maximum | 999 |
| Decile 9 | 36 |
| Decile 8 | 16 |
| Decile 7 | 10 |
| Decile 6 | 6 |
| Median | 4 |
| Decile 4 | 3 |
| Decile 3 | 2 |
| Decile 2 | 2 |
| Decile 1 | 1 |
| Minimum | 1 |
|
|
- There are 166 distinct values.
- Mean = 15.5783
- Std.dev = 43.7511
- 1593 items above graph maximum of 71
- 884 items have value -3 (Prefer not to answer)
- 13615 items have value -1 (Do not know)
|
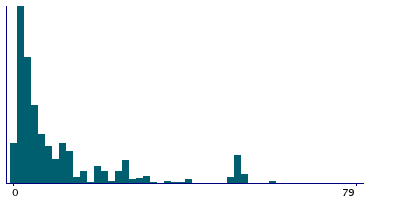
Instance 1 : First repeat assessment visit (2012-13)
6,456 participants, 6,456 items
| Maximum | 936 |
| Decile 9 | 40 |
| Decile 8 | 20 |
| Decile 7 | 12 |
| Decile 6 | 8 |
| Median | 5 |
| Decile 4 | 4 |
| Decile 3 | 2 |
| Decile 2 | 2 |
| Decile 1 | 1 |
| Minimum | 1 |
|
|
- There are 85 distinct values.
- Mean = 16.0887
- Std.dev = 41.172
- 168 items above graph maximum of 79
- 67 items have value -3 (Prefer not to answer)
- 1408 items have value -1 (Do not know)
|
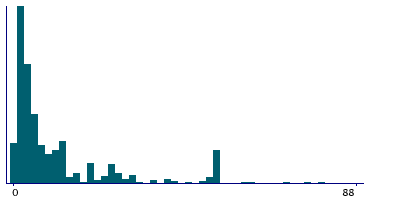
Instance 2 : Imaging visit (2014+)
29,395 participants, 29,395 items
| Maximum | 999 |
| Decile 9 | 46 |
| Decile 8 | 20 |
| Decile 7 | 12 |
| Decile 6 | 8 |
| Median | 5 |
| Decile 4 | 4 |
| Decile 3 | 3 |
| Decile 2 | 2 |
| Decile 1 | 1 |
| Minimum | 1 |
|
|
- There are 120 distinct values.
- Mean = 16.5234
- Std.dev = 42.6222
- 759 items above graph maximum of 91
- 403 items have value -3 (Prefer not to answer)
- 6252 items have value -1 (Do not know)
|
Instance 3 : First repeat imaging visit (2019+)
5,805 participants, 5,805 items
| Maximum | 999 |
| Decile 9 | 40 |
| Decile 8 | 20 |
| Decile 7 | 12 |
| Decile 6 | 8 |
| Median | 5 |
| Decile 4 | 4 |
| Decile 3 | 3 |
| Decile 2 | 2 |
| Decile 1 | 1 |
| Minimum | 1 |
|
|
- There are 80 distinct values.
- Mean = 15.8679
- Std.dev = 39.9434
- 137 items above graph maximum of 79
- 72 items have value -3 (Prefer not to answer)
- 1267 items have value -1 (Do not know)
|
Notes
ACE touchscreen question "How many weeks was the longest period when you were uninterested in things or unable to enjoy the things you used to?"
Question was introduced part way through fieldwork in April 2009.
The following checks were performed:
- If answer < 1 then rejected
- If answer > 999 then rejected
Field 5375 was collected from participants who indicated they have been uninterested in things or unable to enjoy things they used to for at least a week, as defined by their answers to Field 4631
Coding 100291 defines 2 special values:
- -1 represents "Do not know"
- -3 represents "Prefer not to answer"
1 Related Data-Field
| Field ID | Description | Relationship |
|---|
| 4631 | Ever unenthusiastic/disinterested fo ... | Current Field was collected from participants who indicated they have been uninterested in things or unable to enjoy things they used to for at least a week, as defined by their answers to Field 4631 |
6 Applications
| Application ID | Title |
|---|
| 1602 | Association between diet and depression |
| 17435 | Exploring the genetics of irritable bowel syndrome: the ?bellygenes? initiative (project approved by bbmri-lpc) |
| 31187 | Integrative Prioritization of Loci for Alcohol Use Disorders and Associated Complex Traits |
| 16577 | Investigations of the genetic overlap between internalising psychiatric disorders and co-morbid physical health disorders. |
| 14801 | Social isolation and health - what are the mechanisms? |
| 41686 | Understanding the biological, lifestyle and environmental risks and outcomes for multimorbidity in psychiatric disorders |


