Data
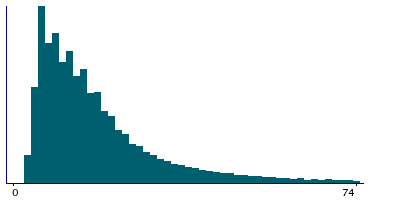
137,735 items of data are available, covering 133,483 participants.
Defined-instances run from 0 to 1, labelled using Instancing
2.
Units of measurement are seconds.
| Maximum | 1034 |
| Decile 9 | 40 |
| Decile 8 | 27 |
| Decile 7 | 21 |
| Decile 6 | 17 |
| Median | 14 |
| Decile 4 | 12 |
| Decile 3 | 10 |
| Decile 2 | 8 |
| Decile 1 | 6 |
| Minimum | 2 |
|
|
- There are 319 distinct values.
- Mean = 20.3316
- Std.dev = 22.0341
- 3471 items above graph maximum of 74
|
2 Instances
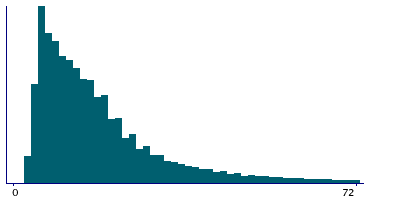
Instance 0 : Initial assessment visit (2006-2010) at which participants were recruited and consent given
117,473 participants, 117,473 items
| Maximum | 1034 |
| Decile 9 | 39 |
| Decile 8 | 27 |
| Decile 7 | 21 |
| Decile 6 | 17 |
| Median | 14 |
| Decile 4 | 12 |
| Decile 3 | 10 |
| Decile 2 | 8 |
| Decile 1 | 6 |
| Minimum | 2 |
|
|
- There are 296 distinct values.
- Mean = 20.1235
- Std.dev = 21.5178
- 3021 items above graph maximum of 72
|
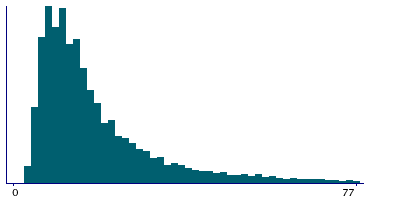
Instance 1 : First repeat assessment visit (2012-13)
20,262 participants, 20,262 items
| Maximum | 715 |
| Decile 9 | 42 |
| Decile 8 | 28 |
| Decile 7 | 21 |
| Decile 6 | 17 |
| Median | 14 |
| Decile 4 | 12 |
| Decile 3 | 10 |
| Decile 2 | 8 |
| Decile 1 | 7 |
| Minimum | 3 |
|
|
- There are 219 distinct values.
- Mean = 21.5377
- Std.dev = 24.782
- 607 items above graph maximum of 77
|


