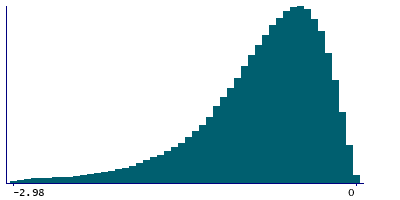
Data
375,742 items of data are available, covering 124,406 participants.
Defined-instances run from 0 to 1, labelled using Instancing
2.
Array indices run from 0 to 5.
Units of measurement are diopters.
| Maximum | 0 |
| Decile 9 | -0.26 |
| Decile 8 | -0.39 |
| Decile 7 | -0.5 |
| Decile 6 | -0.61 |
| Median | -0.73 |
| Decile 4 | -0.86 |
| Decile 3 | -1.02 |
| Decile 2 | -1.23 |
| Decile 1 | -1.62 |
| Minimum | -11.98 |
|

|
- Mean = -0.874688
- Std.dev = 0.665079
- 5862 items below graph minimum of -2.98
|
2 Instances
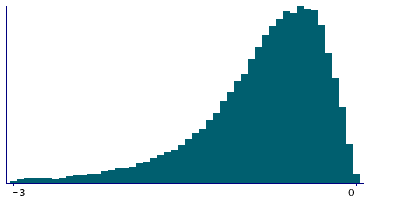
Instance 0 : Initial assessment visit (2006-2010) at which participants were recruited and consent given
109,829 participants, 322,010 items
| Maximum | 0 |
| Decile 9 | -0.26 |
| Decile 8 | -0.39 |
| Decile 7 | -0.5 |
| Decile 6 | -0.61 |
| Median | -0.73 |
| Decile 4 | -0.86 |
| Decile 3 | -1.02 |
| Decile 2 | -1.23 |
| Decile 1 | -1.62 |
| Minimum | -11.98 |
|
|
- Mean = -0.87574
- Std.dev = 0.666091
- 5052 items below graph minimum of -2.98
|
Instance 1 : First repeat assessment visit (2012-13)
18,388 participants, 53,732 items
| Maximum | 0 |
| Decile 9 | -0.26 |
| Decile 8 | -0.38 |
| Decile 7 | -0.49 |
| Decile 6 | -0.6 |
| Median | -0.72 |
| Decile 4 | -0.85 |
| Decile 3 | -1.01 |
| Decile 2 | -1.23 |
| Decile 1 | -1.63 |
| Minimum | -8.82 |
|
|
- Mean = -0.868386
- Std.dev = 0.658945
- 794 items below graph minimum of -3
|
Notes
This is the cylindrical power of keratometry results taken at 3mm for the left eye (0 indicates none)
1 Related Data-Field
| Field ID | Description | Relationship |
|---|
| 5116 | 3mm cylindrical power (right) | Current Field is the opposite-side complement to Field 5116 |


