Data
385,041 items of data are available, covering 132,972 participants.
Defined-instances run from 0 to 1, labelled using Instancing
2.
Array indices run from 0 to 15.
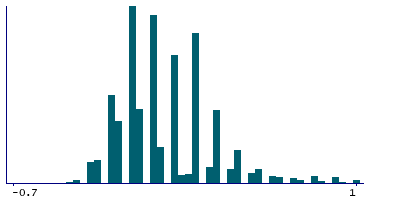
| Maximum | 1.3 |
| Decile 9 | 0.4 |
| Decile 8 | 0.2 |
| Decile 7 | 0.2 |
| Decile 6 | 0.1 |
| Median | 0 |
| Decile 4 | 0 |
| Decile 3 | -0.1 |
| Decile 2 | -0.1 |
| Decile 1 | -0.2 |
| Minimum | -0.7 |
|
|
- Mean = 0.0610029
- Std.dev = 0.245968
- 1873 items above graph maximum of 1
|
2 Instances
Instance 0 : Initial assessment visit (2006-2010) at which participants were recruited and consent given
117,010 participants, 328,225 items
| Maximum | 1.3 |
| Decile 9 | 0.4 |
| Decile 8 | 0.2 |
| Decile 7 | 0.2 |
| Decile 6 | 0.1 |
| Median | 0 |
| Decile 4 | 0 |
| Decile 3 | -0.1 |
| Decile 2 | -0.1 |
| Decile 1 | -0.2 |
| Minimum | -0.7 |
|

|
- Mean = 0.0661635
- Std.dev = 0.245678
- 1600 items above graph maximum of 1
|
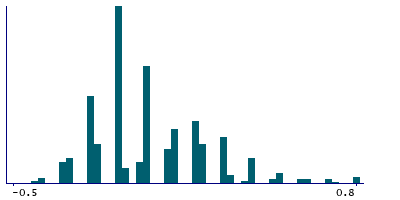
Instance 1 : First repeat assessment visit (2012-13)
20,178 participants, 56,816 items
| Maximum | 1.3 |
| Decile 9 | 0.3 |
| Decile 8 | 0.2 |
| Decile 7 | 0.1 |
| Decile 6 | 0 |
| Median | 0 |
| Decile 4 | -0.1 |
| Decile 3 | -0.1 |
| Decile 2 | -0.2 |
| Decile 1 | -0.2 |
| Minimum | -0.5 |
|
|
- Mean = 0.0311902
- Std.dev = 0.245524
- 749 items above graph maximum of 0.8
|
Notes
Visual acuity (right), logMAR for round
1 Related Data-Field
| Field ID | Description | Relationship |
|---|
| 5078 | logMAR in round (left) | Field 5078 is the opposite-side complement to Current Field |


