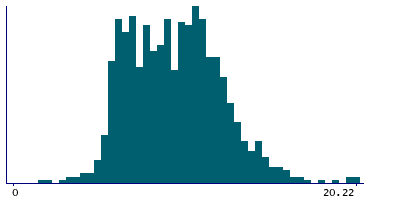
Data
1,380 items of data are available, covering 1,378 participants.
Defined-instances run from 0 to 3, labelled using Instancing
2.
Units of measurement are m/s.
| Maximum | 50 |
| Decile 9 | 13.46 |
| Decile 8 | 12 |
| Decile 7 | 11.15 |
| Decile 6 | 10.48 |
| Median | 9.72 |
| Decile 4 | 8.88 |
| Decile 3 | 8 |
| Decile 2 | 7.06 |
| Decile 1 | 6.27 |
| Minimum | 1.89 |
|
|
- Mean = 10.4399
- Std.dev = 6.04923
- 32 items above graph maximum of 20.65
|
4 Instances
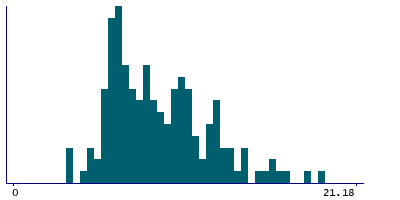
Instance 0 : Initial assessment visit (2006-2010) at which participants were recruited and consent given
161 participants, 161 items
| Maximum | 49 |
| Decile 9 | 13.515 |
| Decile 8 | 12.09 |
| Decile 7 | 10.56 |
| Decile 6 | 9.615 |
| Median | 8.495 |
| Decile 4 | 7.71 |
| Decile 3 | 6.835 |
| Decile 2 | 6.385 |
| Decile 1 | 5.85 |
| Minimum | 3.45 |
|
|
- Mean = 9.84578
- Std.dev = 6.25428
- 4 items above graph maximum of 21.18
|
Instance 1 : First repeat assessment visit (2012-13)
7 participants, 7 items
Too few values for statistical summary.
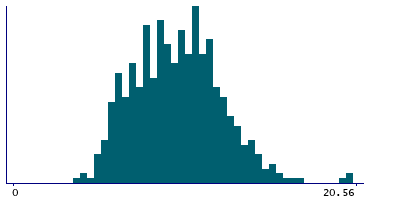
Instance 2 : Imaging visit (2014+)
618 participants, 618 items
| Maximum | 50 |
| Decile 9 | 13.78 |
| Decile 8 | 12.24 |
| Decile 7 | 11.4 |
| Decile 6 | 10.67 |
| Median | 10 |
| Decile 4 | 9 |
| Decile 3 | 8.39 |
| Decile 2 | 7.48 |
| Decile 1 | 6.375 |
| Minimum | 1.89 |
|
|
- Mean = 11.3287
- Std.dev = 7.96518
- 27 items above graph maximum of 21.185
|
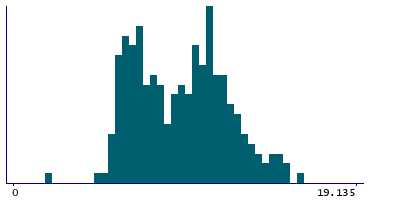
Instance 3 : First repeat imaging visit (2019+)
594 participants, 594 items
| Maximum | 21.08 |
| Decile 9 | 12.98 |
| Decile 8 | 11.9 |
| Decile 7 | 11.09 |
| Decile 6 | 10.5 |
| Median | 9.72 |
| Decile 4 | 8.935 |
| Decile 3 | 8 |
| Decile 2 | 7.11 |
| Decile 1 | 6.39 |
| Minimum | 1.98 |
|
|
- Mean = 9.70525
- Std.dev = 2.59436
- 2 items above graph maximum of 19.57
|


