Data
1,336,416 items of data are available, covering 498,507 participants.
Defined-instances run from 0 to 3, labelled using Instancing
2.
Array indices run from 1 to 3.
| Maximum | 146 |
| Decile 9 | 6 |
| Decile 8 | 4 |
| Decile 7 | 3 |
| Decile 6 | 2 |
| Median | 1 |
| Decile 4 | 0 |
| Decile 3 | 0 |
| Decile 2 | 0 |
| Decile 1 | 0 |
| Minimum | 0 |
|

|
- There are 72 distinct values.
- Mean = 2.36637
- Std.dev = 3.15246
- 17952 items above graph maximum of 12
|
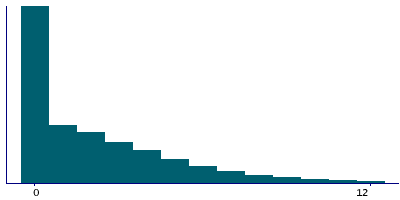
4 Instances
Instance 0 : Initial assessment visit (2006-2010) at which participants were recruited and consent given
497,319 participants, 994,638 items
| Maximum | 146 |
| Decile 9 | 6 |
| Decile 8 | 4 |
| Decile 7 | 3 |
| Decile 6 | 2 |
| Median | 1 |
| Decile 4 | 1 |
| Decile 3 | 0 |
| Decile 2 | 0 |
| Decile 1 | 0 |
| Minimum | 0 |
|
|
- There are 71 distinct values.
- Mean = 2.34493
- Std.dev = 3.12091
- 12758 items above graph maximum of 12
|
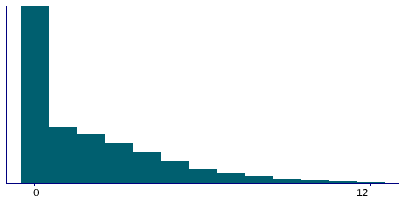
Instance 1 : First repeat assessment visit (2012-13)
20,314 participants, 40,628 items
| Maximum | 36 |
| Decile 9 | 6 |
| Decile 8 | 4 |
| Decile 7 | 3 |
| Decile 6 | 2 |
| Median | 1 |
| Decile 4 | 0 |
| Decile 3 | 0 |
| Decile 2 | 0 |
| Decile 1 | 0 |
| Minimum | 0 |
|
|
- There are 33 distinct values.
- Mean = 2.0989
- Std.dev = 2.83093
- 357 items above graph maximum of 12
|
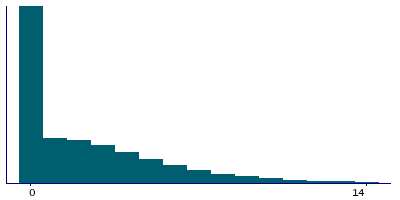
Instance 2 : Imaging visit (2014+)
94,776 participants, 249,359 items
| Maximum | 48 |
| Decile 9 | 7 |
| Decile 8 | 5 |
| Decile 7 | 3 |
| Decile 6 | 2 |
| Median | 1 |
| Decile 4 | 0 |
| Decile 3 | 0 |
| Decile 2 | 0 |
| Decile 1 | 0 |
| Minimum | 0 |
|
|
- There are 45 distinct values.
- Mean = 2.47368
- Std.dev = 3.30217
- 2306 items above graph maximum of 14
|
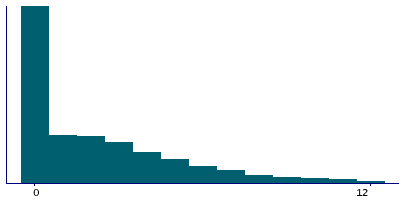
Instance 3 : First repeat imaging visit (2019+)
19,939 participants, 51,791 items
| Maximum | 77 |
| Decile 9 | 7 |
| Decile 8 | 5 |
| Decile 7 | 3 |
| Decile 6 | 2 |
| Median | 1 |
| Decile 4 | 0 |
| Decile 3 | 0 |
| Decile 2 | 0 |
| Decile 1 | 0 |
| Minimum | 0 |
|
|
- There are 35 distinct values.
- Mean = 2.47132
- Std.dev = 3.23492
- 402 items above graph maximum of 14
|


