Data
227,366 items of data are available, covering 185,028 participants.
Some values have special meanings defined by Data-Coding
100291.
Defined-instances run from 0 to 3, labelled using Instancing
2.
Units of measurement are years.
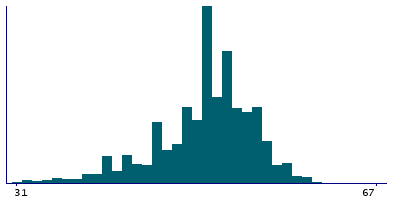
| Maximum | 70 |
| Decile 9 | 55 |
| Decile 8 | 54 |
| Decile 7 | 52 |
| Decile 6 | 52 |
| Median | 50 |
| Decile 4 | 50 |
| Decile 3 | 48 |
| Decile 2 | 46 |
| Decile 1 | 43 |
| Minimum | 18 |
|

|
- There are 53 distinct values.
- Mean = 49.8579
- Std.dev = 5.08902
- 1111 items below graph minimum of 31
- 8 items above graph maximum of 67
- 488 items have value -3 (Prefer not to answer)
- 15711 items have value -1 (Do not know)
|
4 Instances
Instance 0 : Initial assessment visit (2006-2010) at which participants were recruited and consent given
165,192 participants, 165,192 items
| Maximum | 68 |
| Decile 9 | 55 |
| Decile 8 | 54 |
| Decile 7 | 52 |
| Decile 6 | 51 |
| Median | 50 |
| Decile 4 | 50 |
| Decile 3 | 48 |
| Decile 2 | 46 |
| Decile 1 | 43 |
| Minimum | 18 |
|
|
- There are 51 distinct values.
- Mean = 49.6641
- Std.dev = 5.14149
- 895 items below graph minimum of 31
- 2 items above graph maximum of 67
- 370 items have value -3 (Prefer not to answer)
- 10348 items have value -1 (Do not know)
|
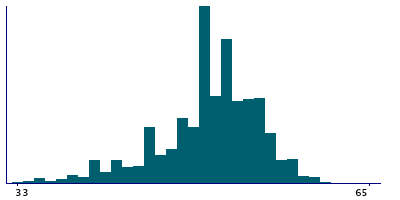
Instance 1 : First repeat assessment visit (2012-13)
7,709 participants, 7,709 items
| Maximum | 65 |
| Decile 9 | 55 |
| Decile 8 | 54 |
| Decile 7 | 53 |
| Decile 6 | 52 |
| Median | 51 |
| Decile 4 | 50 |
| Decile 3 | 49 |
| Decile 2 | 47 |
| Decile 1 | 44 |
| Minimum | 20 |
|
|
- There are 41 distinct values.
- Mean = 50.2242
- Std.dev = 4.91189
- 46 items below graph minimum of 33
- 16 items have value -3 (Prefer not to answer)
- 549 items have value -1 (Do not know)
|
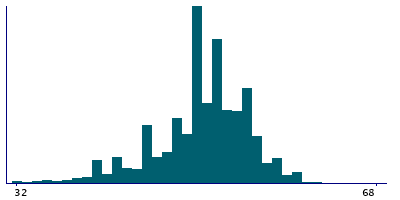
Instance 2 : Imaging visit (2014+)
44,988 participants, 44,988 items
| Maximum | 70 |
| Decile 9 | 56 |
| Decile 8 | 54 |
| Decile 7 | 53 |
| Decile 6 | 52 |
| Median | 51 |
| Decile 4 | 50 |
| Decile 3 | 49 |
| Decile 2 | 47 |
| Decile 1 | 44 |
| Minimum | 18 |
|
|
- There are 53 distinct values.
- Mean = 50.4008
- Std.dev = 4.89445
- 181 items below graph minimum of 32
- 2 items above graph maximum of 68
- 94 items have value -3 (Prefer not to answer)
- 3906 items have value -1 (Do not know)
|
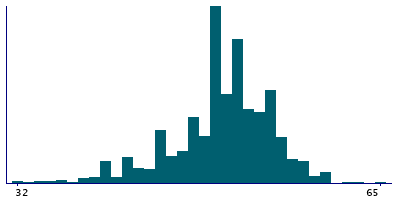
Instance 3 : First repeat imaging visit (2019+)
9,477 participants, 9,477 items
| Maximum | 70 |
| Decile 9 | 56 |
| Decile 8 | 54 |
| Decile 7 | 53 |
| Decile 6 | 52 |
| Median | 51 |
| Decile 4 | 50 |
| Decile 3 | 49 |
| Decile 2 | 47 |
| Decile 1 | 44 |
| Minimum | 18 |
|
|
- There are 49 distinct values.
- Mean = 50.4502
- Std.dev = 4.94342
- 41 items below graph minimum of 32
- 1 item above graph maximum of 68
- 8 items have value -3 (Prefer not to answer)
- 908 items have value -1 (Do not know)
|
Notes
ACE touchscreen question "How old were you when your periods stopped?"
The following checks were performed:
- If answer < Age at first period then rejected
- If answer > Participants age then rejected
- If answer > 70 then rejected
- If answer < 40 then participant asked to confirm
- If answer > 60 then participant asked to confirm
If the participant activated the Help button they were shown the message:
If you are unsure, please provide an estimate or select Do not know.
|
Field 3581 was collected from women who indicated that their periods had stopped, as defined by their answers to Field 2724
Coding 100291 defines 2 special values:
- -1 represents "Do not know"
- -3 represents "Prefer not to answer"
1 Related Data-Field
| Field ID | Description | Relationship |
|---|
| 2724 | Had menopause | Current Field was collected from women who indicated that their periods had stopped, as defined by their answers to Field 2724 |
3 Applications
| Application ID | Title |
|---|
| 26629 | Cross-cultural variations in female reproductive health and non-communicable diseases: analysis of 500,000 participants from the UKBiobank and the InterLACE consortium |
| 5791 | Development and validation of risk prediction model for breast and ovarian cancers |
| 871 | Genetic factors associated with being at different extremes of the reproductive lifespan |


