Data
480,242 items of data are available, covering 467,390 participants.
Defined-instances run from 0 to 1, labelled using Instancing
2.
Units of measurement are mmol/mol.
| Maximum | 515.2 |
| Decile 9 | 41.1 |
| Decile 8 | 38.7 |
| Decile 7 | 37.3 |
| Decile 6 | 36.2 |
| Median | 35.3 |
| Decile 4 | 34.3 |
| Decile 3 | 33.3 |
| Decile 2 | 32.2 |
| Decile 1 | 30.5 |
| Minimum | 15 |
|

|
- Mean = 36.1432
- Std.dev = 6.74969
- 259 items below graph minimum of 19.9
- 13123 items above graph maximum of 51.7
|
2 Instances
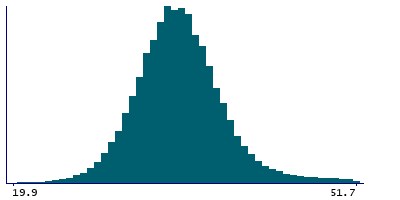
Instance 0 : Initial assessment visit (2006-2010) at which participants were recruited and consent given
465,985 participants, 465,985 items
| Maximum | 515.2 |
| Decile 9 | 41.1 |
| Decile 8 | 38.6 |
| Decile 7 | 37.3 |
| Decile 6 | 36.2 |
| Median | 35.2 |
| Decile 4 | 34.3 |
| Decile 3 | 33.3 |
| Decile 2 | 32.2 |
| Decile 1 | 30.5 |
| Minimum | 15 |
|
|
- Mean = 36.1325
- Std.dev = 6.77748
- 254 items below graph minimum of 19.9
- 12810 items above graph maximum of 51.7
|
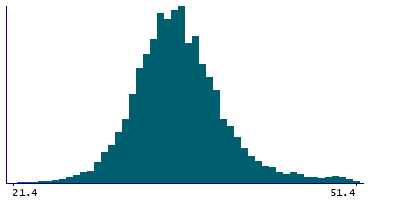
Instance 1 : First repeat assessment visit (2012-13)
14,257 participants, 14,257 items
| Maximum | 133.2 |
| Decile 9 | 41.4 |
| Decile 8 | 39 |
| Decile 7 | 37.6 |
| Decile 6 | 36.6 |
| Median | 35.7 |
| Decile 4 | 34.9 |
| Decile 3 | 34 |
| Decile 2 | 32.9 |
| Decile 1 | 31.4 |
| Minimum | 15.2 |
|
|
- Mean = 36.4936
- Std.dev = 5.75718
- 9 items below graph minimum of 21.4
- 326 items above graph maximum of 51.4
|
Notes
Measured by HPLC analysis on a Bio-Rad VARIANT II Turbo
0 Related Data-Fields
There are no related data-fields
6 Applications
| Application ID | Title |
|---|
| 13721 | Causal associations of circulating biomarkers with cardiovascular disease |
| 50016 | Dummy application for biomarker data |
| 48818 | Evaluate the causal effects of diet-modifiable biomarkers on clinical outcomes using Mendelian randomization |
| 45925 | Risk Factors, Biomarkers and Impact of Major Vision-Threatening Eye Diseases |
| 46466 | Serum cardiometabolic and liver function markers in relation to colorectal cancer risk and survival |
| 5167 | The role of serum-based small molecule antioxidants in preventing and predicting age-related phenotypes and respiratory cancer |

