Data
501,983 items of data are available, covering 477,953 participants.
Defined-instances run from 0 to 2, labelled using Instancing
2.
Units of measurement are percent.
| Maximum | 100 |
| Decile 9 | 4.74 |
| Decile 8 | 3.6 |
| Decile 7 | 2.97 |
| Decile 6 | 2.5 |
| Median | 2.1 |
| Decile 4 | 1.8 |
| Decile 3 | 1.5 |
| Decile 2 | 1.2 |
| Decile 1 | 0.9 |
| Minimum | 0 |
|

|
- Mean = 2.56798
- Std.dev = 1.87013
- 6297 items above graph maximum of 8.58
|
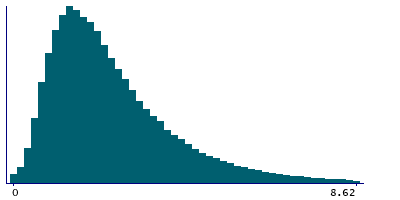
3 Instances
Instance 0 : Initial assessment visit (2006-2010) at which participants were recruited and consent given
476,756 participants, 476,756 items
| Maximum | 100 |
| Decile 9 | 4.76 |
| Decile 8 | 3.61 |
| Decile 7 | 2.98 |
| Decile 6 | 2.5 |
| Median | 2.11 |
| Decile 4 | 1.8 |
| Decile 3 | 1.5 |
| Decile 2 | 1.2 |
| Decile 1 | 0.9 |
| Minimum | 0 |
|
|
- Mean = 2.57239
- Std.dev = 1.87535
- 5859 items above graph maximum of 8.62
|
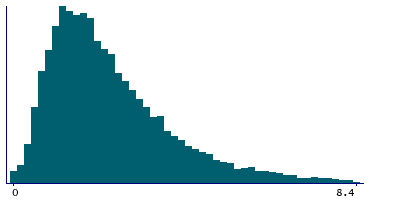
Instance 1 : First repeat assessment visit (2012-13)
19,379 participants, 19,379 items
| Maximum | 34.8 |
| Decile 9 | 4.6 |
| Decile 8 | 3.5 |
| Decile 7 | 2.89 |
| Decile 6 | 2.4 |
| Median | 2 |
| Decile 4 | 1.7 |
| Decile 3 | 1.4 |
| Decile 2 | 1.13 |
| Decile 1 | 0.8 |
| Minimum | 0 |
|
|
- Mean = 2.45542
- Std.dev = 1.73898
- 208 items above graph maximum of 8.4
|
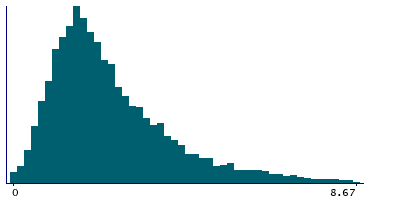
Instance 2 : Imaging visit (2014+)
5,848 participants, 5,848 items
| Maximum | 33.22 |
| Decile 9 | 4.79 |
| Decile 8 | 3.63 |
| Decile 7 | 2.96 |
| Decile 6 | 2.475 |
| Median | 2.11 |
| Decile 4 | 1.81 |
| Decile 3 | 1.55 |
| Decile 2 | 1.24 |
| Decile 1 | 0.9 |
| Minimum | 0 |
|
|
- Mean = 2.5811
- Std.dev = 1.85159
- 81 items above graph maximum of 8.68
|
Notes
Result of "Eosinophils Percentage" assay, performed on blood sample, obtained from UK Biobank assessment centre visit. Eosinophils (Percentage) is calculated as the proportion of eosinophils in the leukocytes.
4 Related Data-Fields
| Field ID | Description | Relationship |
|---|
| 30214 | Eosinophill percentage acquisition route | Field 30214 is the data route used to acquire the result in Current Field |
| 30212 | Eosinophill percentage acquisition time | Field 30212 is the original acquisition time of the sample generating the result in Current Field. |
| 30213 | Eosinophill percentage device ID | Field 30213 is the ID of the device user to generate the result in Current Field |
| 30211 | Eosinophill percentage freeze-thaw c ... | Field 30211 is the number of freeze-thaw cycles a sample underwent before generating the result in Current Field. |
1 Application
| Application ID | Title |
|---|
| 45925 | Risk Factors, Biomarkers and Impact of Major Vision-Threatening Eye Diseases |

