Data
501,983 items of data are available, covering 477,953 participants.
Defined-instances run from 0 to 2, labelled using Instancing
2.
Units of measurement are percent.
| Maximum | 100 |
| Decile 9 | 71.3 |
| Decile 8 | 67.9 |
| Decile 7 | 65.4 |
| Decile 6 | 63.2 |
| Median | 61.2 |
| Decile 4 | 59.1 |
| Decile 3 | 56.9 |
| Decile 2 | 54.3 |
| Decile 1 | 50.5 |
| Minimum | 0 |
|
|
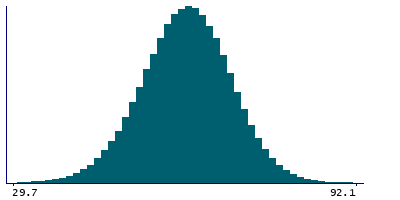
- Mean = 60.9513
- Std.dev = 8.5439
- 1401 items below graph minimum of 29.7
- 108 items above graph maximum of 92.1
|
3 Instances
Instance 0 : Initial assessment visit (2006-2010) at which participants were recruited and consent given
476,756 participants, 476,756 items
| Maximum | 97.7 |
| Decile 9 | 71.2 |
| Decile 8 | 67.8 |
| Decile 7 | 65.3 |
| Decile 6 | 63.2 |
| Median | 61.1 |
| Decile 4 | 59.1 |
| Decile 3 | 56.9 |
| Decile 2 | 54.2 |
| Decile 1 | 50.4 |
| Minimum | 0 |
|

|
- Mean = 60.8808
- Std.dev = 8.5261
- 1334 items below graph minimum of 29.6
- 98 items above graph maximum of 92
|
Instance 1 : First repeat assessment visit (2012-13)
19,379 participants, 19,379 items
| Maximum | 100 |
| Decile 9 | 72.6 |
| Decile 8 | 68.9 |
| Decile 7 | 66.5 |
| Decile 6 | 64.2 |
| Median | 62.1 |
| Decile 4 | 60 |
| Decile 3 | 57.6 |
| Decile 2 | 54.9 |
| Decile 1 | 51 |
| Minimum | 0 |
|

|
- Mean = 61.8909
- Std.dev = 8.72045
- 31 items below graph minimum of 29.4
- 9 items above graph maximum of 94.2
|
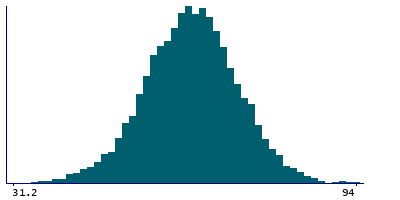
Instance 2 : Imaging visit (2014+)
5,848 participants, 5,848 items
| Maximum | 94 |
| Decile 9 | 74.4 |
| Decile 8 | 70.7 |
| Decile 7 | 68.1 |
| Decile 6 | 65.9 |
| Median | 63.8 |
| Decile 4 | 61.7 |
| Decile 3 | 59.35 |
| Decile 2 | 56.7 |
| Decile 1 | 52.8 |
| Minimum | 0 |
|
|
- Mean = 63.5806
- Std.dev = 8.79849
- 15 items below graph minimum of 31.2
|
Notes
Result of "Neutrophils Percentage" assay, performed on blood sample, obtained from UK Biobank assessment centre visit. Neutrophils (Percentage) is calculated as the proportion of neutrophils in the leukocytes.
4 Related Data-Fields
| Field ID | Description | Relationship |
|---|
| 30204 | Neutrophill percentage acquisition route | Field 30204 is the data route used to acquire the result in Current Field |
| 30202 | Neutrophill percentage acquisition time | Field 30202 is the original acquisition time of the sample generating the result in Current Field. |
| 30203 | Neutrophill percentage device ID | Field 30203 is the ID of the device user to generate the result in Current Field |
| 30201 | Neutrophill percentage freeze-thaw c ... | Field 30201 is the number of freeze-thaw cycles a sample underwent before generating the result in Current Field. |
1 Application
| Application ID | Title |
|---|
| 45925 | Risk Factors, Biomarkers and Impact of Major Vision-Threatening Eye Diseases |

