Data
501,976 items of data are available, covering 477,948 participants.
Defined-instances run from 0 to 2, labelled using Instancing
2.
Units of measurement are 10^9 cells/Litre.
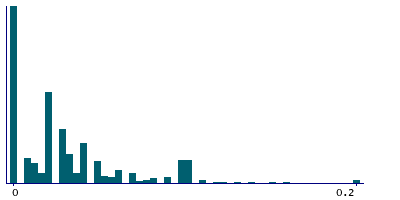
| Maximum | 3.03 |
| Decile 9 | 0.1 |
| Decile 8 | 0.05 |
| Decile 7 | 0.04 |
| Decile 6 | 0.03 |
| Median | 0.02 |
| Decile 4 | 0.02 |
| Decile 3 | 0.01 |
| Decile 2 | 0 |
| Decile 1 | 0 |
| Minimum | 0 |
|
|
- Mean = 0.0335664
- Std.dev = 0.0514224
- 3115 items above graph maximum of 0.2
|
3 Instances
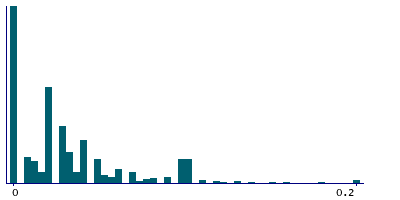
Instance 0 : Initial assessment visit (2006-2010) at which participants were recruited and consent given
476,750 participants, 476,750 items
| Maximum | 3.03 |
| Decile 9 | 0.1 |
| Decile 8 | 0.05 |
| Decile 7 | 0.04 |
| Decile 6 | 0.03 |
| Median | 0.02 |
| Decile 4 | 0.02 |
| Decile 3 | 0.01 |
| Decile 2 | 0 |
| Decile 1 | 0 |
| Minimum | 0 |
|
|
- Mean = 0.0340581
- Std.dev = 0.0516221
- 3028 items above graph maximum of 0.2
|
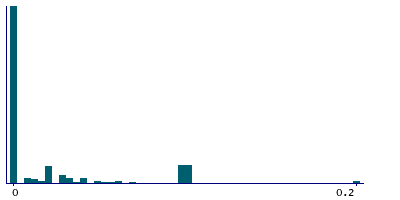
Instance 1 : First repeat assessment visit (2012-13)
19,378 participants, 19,378 items
| Maximum | 1.2 |
| Decile 9 | 0.1 |
| Decile 8 | 0.03 |
| Decile 7 | 0.02 |
| Decile 6 | 0 |
| Median | 0 |
| Decile 4 | 0 |
| Decile 3 | 0 |
| Decile 2 | 0 |
| Decile 1 | 0 |
| Minimum | 0 |
|
|
- Mean = 0.0226448
- Std.dev = 0.0493187
- 80 items above graph maximum of 0.2
|
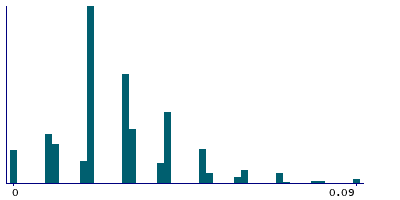
Instance 2 : Imaging visit (2014+)
5,848 participants, 5,848 items
| Maximum | 1.31 |
| Decile 9 | 0.05 |
| Decile 8 | 0.04 |
| Decile 7 | 0.03 |
| Decile 6 | 0.03 |
| Median | 0.03 |
| Decile 4 | 0.02 |
| Decile 3 | 0.02 |
| Decile 2 | 0.02 |
| Decile 1 | 0.01 |
| Minimum | 0 |
|
|
- Mean = 0.0296751
- Std.dev = 0.0351973
- 78 items above graph maximum of 0.09
|
Notes
Result of "Basophils Number" assay, performed on blood sample, obtained from UK Biobank assessment centre visit. Basophils count is the proportion of ( basophils / 100 ) x white blood cell count.
4 Related Data-Fields
| Field ID | Description | Relationship |
|---|
| 30164 | Basophill count acquisition route | Field 30164 is the data route used to acquire the result in Current Field |
| 30162 | Basophill count acquisition time | Field 30162 is the original acquisition time of the sample generating the result in Current Field. |
| 30163 | Basophill count device ID | Field 30163 is the ID of the device user to generate the result in Current Field |
| 30161 | Basophill count freeze-thaw cycles | Field 30161 is the number of freeze-thaw cycles a sample underwent before generating the result in Current Field. |
1 Application
| Application ID | Title |
|---|
| 45925 | Risk Factors, Biomarkers and Impact of Major Vision-Threatening Eye Diseases |

