Data
501,976 items of data are available, covering 477,948 participants.
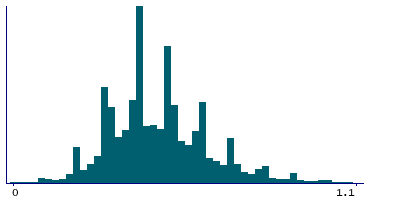
Defined-instances run from 0 to 2, labelled using Instancing
2.
Units of measurement are 10^9 cells/Litre.
| Maximum | 113.39 |
| Decile 9 | 0.7 |
| Decile 8 | 0.6 |
| Decile 7 | 0.53 |
| Decile 6 | 0.5 |
| Median | 0.45 |
| Decile 4 | 0.4 |
| Decile 3 | 0.39 |
| Decile 2 | 0.33 |
| Decile 1 | 0.3 |
| Minimum | 0 |
|
|
- Mean = 0.473862
- Std.dev = 0.271689
- 3033 items above graph maximum of 1.1
|
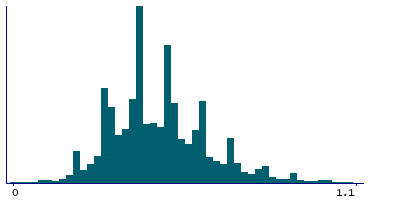
3 Instances
Instance 0 : Initial assessment visit (2006-2010) at which participants were recruited and consent given
476,750 participants, 476,750 items
| Maximum | 113.39 |
| Decile 9 | 0.7 |
| Decile 8 | 0.6 |
| Decile 7 | 0.53 |
| Decile 6 | 0.5 |
| Median | 0.45 |
| Decile 4 | 0.4 |
| Decile 3 | 0.39 |
| Decile 2 | 0.33 |
| Decile 1 | 0.3 |
| Minimum | 0 |
|
|
- Mean = 0.475982
- Std.dev = 0.273025
- 2814 items above graph maximum of 1.1
|
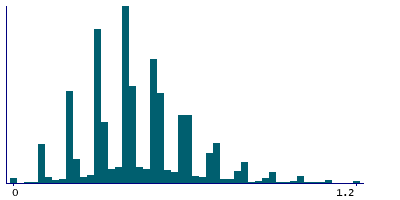
Instance 1 : First repeat assessment visit (2012-13)
19,378 participants, 19,378 items
| Maximum | 13.68 |
| Decile 9 | 0.7 |
| Decile 8 | 0.6 |
| Decile 7 | 0.5 |
| Decile 6 | 0.5 |
| Median | 0.4 |
| Decile 4 | 0.4 |
| Decile 3 | 0.3 |
| Decile 2 | 0.3 |
| Decile 1 | 0.2 |
| Minimum | 0 |
|
|
- Mean = 0.44617
- Std.dev = 0.244543
- 87 items above graph maximum of 1.2
|
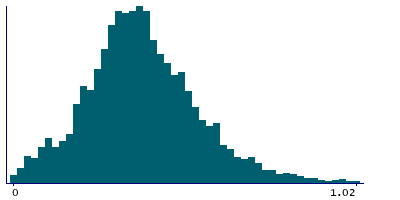
Instance 2 : Imaging visit (2014+)
5,848 participants, 5,848 items
| Maximum | 5.7 |
| Decile 9 | 0.6 |
| Decile 8 | 0.51 |
| Decile 7 | 0.46 |
| Decile 6 | 0.41 |
| Median | 0.37 |
| Decile 4 | 0.33 |
| Decile 3 | 0.3 |
| Decile 2 | 0.25 |
| Decile 1 | 0.18 |
| Minimum | 0 |
|
|
- Mean = 0.392786
- Std.dev = 0.226788
- 47 items above graph maximum of 1.02
|
Notes
Result of "Monocytes Number" assay, performed on blood sample, obtained from UK Biobank assessment centre visit. Monocyte count is the proportion of ( monoctyes / 100 ) x white blood cell count.
4 Related Data-Fields
| Field ID | Description | Relationship |
|---|
| 30134 | Monocyte count acquisition route | Field 30134 is the data route used to acquire the result in Current Field |
| 30132 | Monocyte count acquisition time | Field 30132 is the original acquisition time of the sample generating the result in Current Field. |
| 30133 | Monocyte count device ID | Field 30133 is the ID of the device user to generate the result in Current Field |
| 30131 | Monocyte count freeze-thaw cycles | Field 30131 is the number of freeze-thaw cycles a sample underwent before generating the result in Current Field. |
1 Application
| Application ID | Title |
|---|
| 45925 | Risk Factors, Biomarkers and Impact of Major Vision-Threatening Eye Diseases |

