Data
501,976 items of data are available, covering 477,948 participants.
Defined-instances run from 0 to 2, labelled using Instancing
2.
Units of measurement are 10^9 cells/Litre.
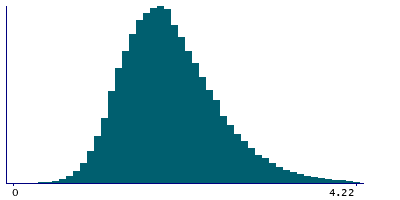
| Maximum | 196.41 |
| Decile 9 | 2.73 |
| Decile 8 | 2.4 |
| Decile 7 | 2.2 |
| Decile 6 | 2 |
| Median | 1.88 |
| Decile 4 | 1.72 |
| Decile 3 | 1.6 |
| Decile 2 | 1.43 |
| Decile 1 | 1.24 |
| Minimum | 0 |
|
|
- Mean = 1.96307
- Std.dev = 1.19136
- 2306 items above graph maximum of 4.22
|
3 Instances
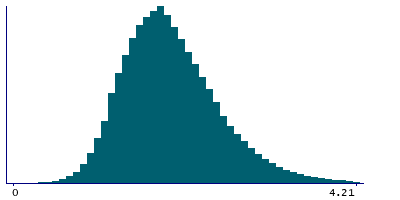
Instance 0 : Initial assessment visit (2006-2010) at which participants were recruited and consent given
476,750 participants, 476,750 items
| Maximum | 196.41 |
| Decile 9 | 2.73 |
| Decile 8 | 2.4 |
| Decile 7 | 2.2 |
| Decile 6 | 2 |
| Median | 1.88 |
| Decile 4 | 1.72 |
| Decile 3 | 1.6 |
| Decile 2 | 1.44 |
| Decile 1 | 1.25 |
| Minimum | 0 |
|
|
- Mean = 1.96599
- Std.dev = 1.17281
- 2226 items above graph maximum of 4.21
|
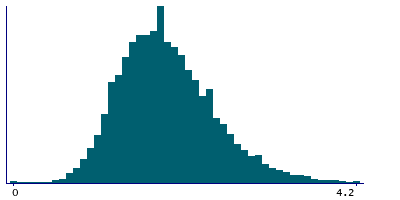
Instance 1 : First repeat assessment visit (2012-13)
19,378 participants, 19,378 items
| Maximum | 135.22 |
| Decile 9 | 2.7 |
| Decile 8 | 2.36 |
| Decile 7 | 2.1 |
| Decile 6 | 2 |
| Median | 1.8 |
| Decile 4 | 1.7 |
| Decile 3 | 1.51 |
| Decile 2 | 1.4 |
| Decile 1 | 1.2 |
| Minimum | 0 |
|
|
- Mean = 1.92663
- Std.dev = 1.61834
- 85 items above graph maximum of 4.2
|
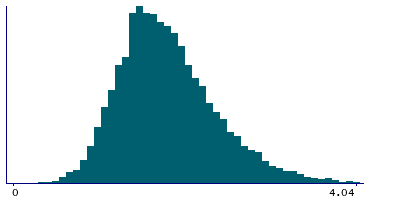
Instance 2 : Imaging visit (2014+)
5,848 participants, 5,848 items
| Maximum | 53.26 |
| Decile 9 | 2.6 |
| Decile 8 | 2.27 |
| Decile 7 | 2.05 |
| Decile 6 | 1.89 |
| Median | 1.74 |
| Decile 4 | 1.61 |
| Decile 3 | 1.48 |
| Decile 2 | 1.35 |
| Decile 1 | 1.16 |
| Minimum | 0.22 |
|
|
- Mean = 1.84622
- Std.dev = 1.00072
- 29 items above graph maximum of 4.04
|
Notes
Result of "Lymphocytes Number" assay, performed on blood sample, obtained from UK Biobank assessment centre visit. Lymphocyte count is the proportion of ( lymphoctyes / 100 ) x white blood cell count
4 Related Data-Fields
| Field ID | Description | Relationship |
|---|
| 30124 | Lymphocyte count acquisition route | Field 30124 is the data route used to acquire the result in Current Field |
| 30122 | Lymphocyte count acquisition time | Field 30122 is the original acquisition time of the sample generating the result in Current Field. |
| 30123 | Lymphocyte count device ID | Field 30123 is the ID of the device user to generate the result in Current Field |
| 30121 | Lymphocyte count freeze-thaw cycles | Field 30121 is the number of freeze-thaw cycles a sample underwent before generating the result in Current Field. |
1 Application
| Application ID | Title |
|---|
| 45925 | Risk Factors, Biomarkers and Impact of Major Vision-Threatening Eye Diseases |

