Data
90,479 items of data are available, covering 85,381 participants.
Defined-instances run from 2 to 3, labelled using Instancing
2.
Units of measurement are AU.
| Maximum | 0.624873 |
| Decile 9 | 0.238367 |
| Decile 8 | 0.188039 |
| Decile 7 | 0.154534 |
| Decile 6 | 0.127378 |
| Median | 0.104734 |
| Decile 4 | 0.0856873 |
| Decile 3 | 0.0685425 |
| Decile 2 | 0.0510452 |
| Decile 1 | 0.0346374 |
| Minimum | 0.000140581 |
|

|
- Mean = 0.124025
- Std.dev = 0.0836207
- 315 items above graph maximum of 0.442096
|
2 Instances
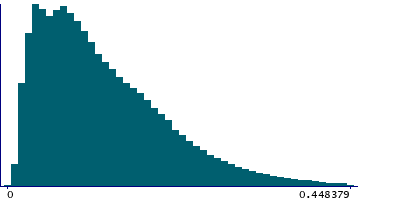
Instance 2 : Imaging visit (2014+)
85,291 participants, 85,291 items
| Maximum | 0.624873 |
| Decile 9 | 0.241727 |
| Decile 8 | 0.190869 |
| Decile 7 | 0.15728 |
| Decile 6 | 0.129895 |
| Median | 0.106841 |
| Decile 4 | 0.0874721 |
| Decile 3 | 0.0700483 |
| Decile 2 | 0.0522684 |
| Decile 1 | 0.0350755 |
| Minimum | 0.000140581 |
|
|
- Mean = 0.126045
- Std.dev = 0.0844866
- 279 items above graph maximum of 0.448379
|
Instance 3 : First repeat imaging visit (2019+)
5,188 participants, 5,188 items
| Maximum | 0.420426 |
| Decile 9 | 0.175194 |
| Decile 8 | 0.135767 |
| Decile 7 | 0.112163 |
| Decile 6 | 0.0922086 |
| Median | 0.0767842 |
| Decile 4 | 0.0629076 |
| Decile 3 | 0.0504551 |
| Decile 2 | 0.0404707 |
| Decile 1 | 0.0304774 |
| Minimum | 0.00567144 |
|

|
- Mean = 0.0908205
- Std.dev = 0.0585647
- 9 items above graph maximum of 0.31991
|
Notes
Standard deviation of the Y linear component of the dMRI eddy currents as calculated by FSL's eddy
0 Related Data-Fields
There are no related data-fields


