Data
502,877 items of data are available, covering 478,811 participants.
Defined-instances run from 0 to 2, labelled using Instancing
2.
Units of measurement are picograms.
| Maximum | 95.67 |
| Decile 9 | 33.49 |
| Decile 8 | 32.79 |
| Decile 7 | 32.3 |
| Decile 6 | 31.89 |
| Median | 31.5 |
| Decile 4 | 31.1 |
| Decile 3 | 30.7 |
| Decile 2 | 30.2 |
| Decile 1 | 29.44 |
| Minimum | 0 |
|

|
- Mean = 31.4508
- Std.dev = 1.92036
- 3848 items below graph minimum of 25.39
- 1420 items above graph maximum of 37.54
|
3 Instances
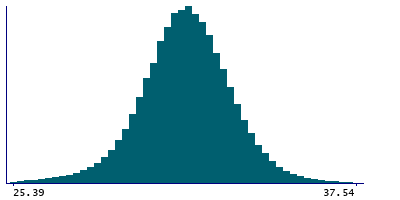
Instance 0 : Initial assessment visit (2006-2010) at which participants were recruited and consent given
477,635 participants, 477,635 items
| Maximum | 95.67 |
| Decile 9 | 33.49 |
| Decile 8 | 32.79 |
| Decile 7 | 32.3 |
| Decile 6 | 31.89 |
| Median | 31.5 |
| Decile 4 | 31.11 |
| Decile 3 | 30.7 |
| Decile 2 | 30.2 |
| Decile 1 | 29.44 |
| Minimum | 0 |
|
|
- Mean = 31.4511
- Std.dev = 1.9216
- 3711 items below graph minimum of 25.39
- 1338 items above graph maximum of 37.54
|
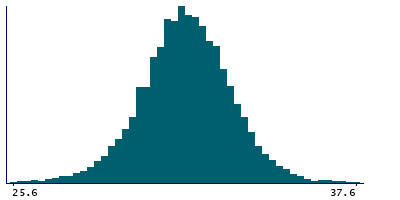
Instance 1 : First repeat assessment visit (2012-13)
19,389 participants, 19,389 items
| Maximum | 70.3 |
| Decile 9 | 33.6 |
| Decile 8 | 32.9 |
| Decile 7 | 32.4 |
| Decile 6 | 32 |
| Median | 31.6 |
| Decile 4 | 31.3 |
| Decile 3 | 30.9 |
| Decile 2 | 30.4 |
| Decile 1 | 29.6 |
| Minimum | 8.9 |
|
|
- Mean = 31.6226
- Std.dev = 1.89703
- 108 items below graph minimum of 25.6
- 64 items above graph maximum of 37.6
|
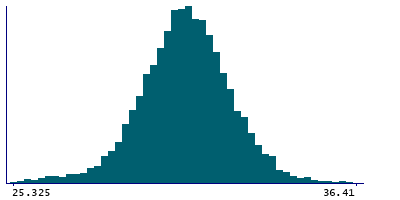
Instance 2 : Imaging visit (2014+)
5,853 participants, 5,853 items
| Maximum | 66.57 |
| Decile 9 | 32.715 |
| Decile 8 | 32.035 |
| Decile 7 | 31.6 |
| Decile 6 | 31.23 |
| Median | 30.89 |
| Decile 4 | 30.56 |
| Decile 3 | 30.18 |
| Decile 2 | 29.71 |
| Decile 1 | 29.025 |
| Minimum | 21.01 |
|
|
- Mean = 30.8625
- Std.dev = 1.77511
- 40 items below graph minimum of 25.335
- 21 items above graph maximum of 36.405
|

