Data
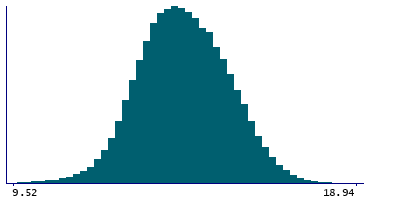
502,883 items of data are available, covering 478,814 participants.
Defined-instances run from 0 to 2, labelled using Instancing
2.
Units of measurement are grams/decilitre.
| Maximum | 22.27 |
| Decile 9 | 15.8 |
| Decile 8 | 15.25 |
| Decile 7 | 14.85 |
| Decile 6 | 14.5 |
| Median | 14.16 |
| Decile 4 | 13.83 |
| Decile 3 | 13.5 |
| Decile 2 | 13.15 |
| Decile 1 | 12.66 |
| Minimum | 0.09 |
|

|
- Mean = 14.1808
- Std.dev = 1.24564
- 755 items below graph minimum of 9.52
- 69 items above graph maximum of 18.94
|
3 Instances
Instance 0 : Initial assessment visit (2006-2010) at which participants were recruited and consent given
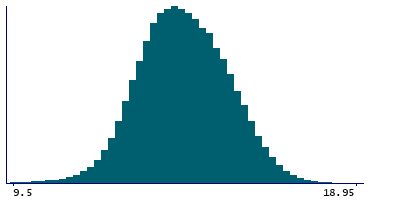
477,638 participants, 477,638 items
| Maximum | 22.27 |
| Decile 9 | 15.8 |
| Decile 8 | 15.25 |
| Decile 7 | 14.84 |
| Decile 6 | 14.5 |
| Median | 14.15 |
| Decile 4 | 13.82 |
| Decile 3 | 13.5 |
| Decile 2 | 13.14 |
| Decile 1 | 12.65 |
| Minimum | 0.09 |
|

|
- Mean = 14.1749
- Std.dev = 1.24695
- 703 items below graph minimum of 9.5
- 63 items above graph maximum of 18.95
|
Instance 1 : First repeat assessment visit (2012-13)
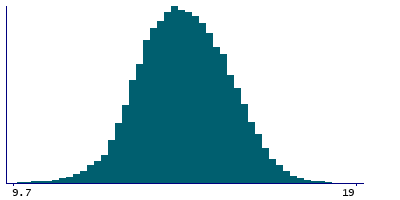
19,390 participants, 19,390 items
| Maximum | 22 |
| Decile 9 | 15.9 |
| Decile 8 | 15.4 |
| Decile 7 | 15 |
| Decile 6 | 14.6 |
| Median | 14.3 |
| Decile 4 | 14 |
| Decile 3 | 13.7 |
| Decile 2 | 13.3 |
| Decile 1 | 12.8 |
| Minimum | 0.1 |
|

|
- Mean = 14.3213
- Std.dev = 1.22097
- 22 items below graph minimum of 9.7
- 4 items above graph maximum of 19
|
Instance 2 : Imaging visit (2014+)
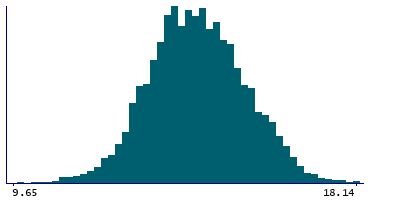
5,855 participants, 5,855 items
| Maximum | 18.14 |
| Decile 9 | 15.77 |
| Decile 8 | 15.2 |
| Decile 7 | 14.81 |
| Decile 6 | 14.47 |
| Median | 14.17 |
| Decile 4 | 13.86 |
| Decile 3 | 13.55 |
| Decile 2 | 13.2 |
| Decile 1 | 12.71 |
| Minimum | 9.37 |
|

|
- Mean = 14.1944
- Std.dev = 1.19105
- 3 items below graph minimum of 9.65
|
Notes
Result of "Haemoglobin Concentration" assay, performed on blood sample, obtained from UK Biobank assessment centre visit.
Analyser operating range was 0 to 99.9g/dL
Typical reference range is 12.1 to 16.3g/dL


