Data
82,772 items of data are available, covering 82,772 participants.
Defined-instances run from 0 to 1, labelled using Instancing
2.
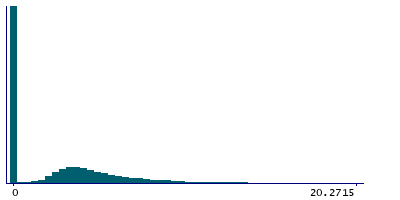
| Maximum | 961 |
| Decile 9 | 10.1357 |
| Decile 8 | 6.07422 |
| Decile 7 | 4.52344 |
| Decile 6 | 3.48047 |
| Median | 2.33789 |
| Decile 4 | 0 |
| Decile 3 | 0 |
| Decile 2 | 0 |
| Decile 1 | 0 |
| Minimum | 0 |
|
|
- Mean = 11.98
- Std.dev = 53.483
- 5651 items above graph maximum of 20.2715
|
2 Instances
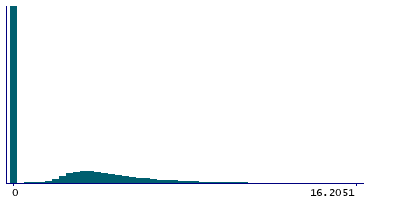
Instance 0 : Initial assessment visit (2006-2010) at which participants were recruited and consent given
67,222 participants, 67,222 items
| Maximum | 961 |
| Decile 9 | 8.10254 |
| Decile 8 | 5.27539 |
| Decile 7 | 3.98633 |
| Decile 6 | 3.00586 |
| Median | 0 |
| Decile 4 | 0 |
| Decile 3 | 0 |
| Decile 2 | 0 |
| Decile 1 | 0 |
| Minimum | 0 |
|
|
- Mean = 10.8194
- Std.dev = 52.6549
- 4025 items above graph maximum of 16.2051
|
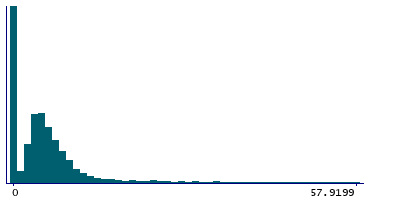
Instance 1 : First repeat assessment visit (2012-13)
15,550 participants, 15,550 items
| Maximum | 585.645 |
| Decile 9 | 28.9609 |
| Decile 8 | 10.1699 |
| Decile 7 | 7.37891 |
| Decile 6 | 5.7832 |
| Median | 4.60352 |
| Decile 4 | 3.57227 |
| Decile 3 | 2.15234 |
| Decile 2 | 0 |
| Decile 1 | 0 |
| Minimum | 0 |
|
|
- Mean = 16.9971
- Std.dev = 56.6514
- 899 items above graph maximum of 57.9219
|
Notes
This field should be used to quality control the values generated by the Topcon Advanced Boundary Segmentation [TABS] software in
Category 100079. Information about how the research group who generated the values quality controlled them for their publication can be seen in
Return 1875.
0 Related Data-Fields
There are no related data-fields
0 Resources
There are no matching Resources
