Data
82,781 items of data are available, covering 82,781 participants.
Defined-instances run from 0 to 1, labelled using Instancing
2.
| Maximum | 450 |
| Decile 9 | 274 |
| Decile 8 | 266 |
| Decile 7 | 262 |
| Decile 6 | 262 |
| Median | 258 |
| Decile 4 | 258 |
| Decile 3 | 254 |
| Decile 2 | 254 |
| Decile 1 | 250 |
| Minimum | -1 |
|

|
- There are 99 distinct values.
- Mean = 259.565
- Std.dev = 32.5473
- 2753 items below graph minimum of 226
- 2831 items above graph maximum of 298
|
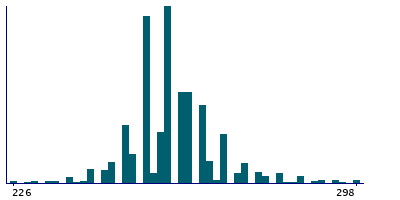
2 Instances
Instance 0 : Initial assessment visit (2006-2010) at which participants were recruited and consent given
67,219 participants, 67,219 items
| Maximum | 450 |
| Decile 9 | 274 |
| Decile 8 | 266 |
| Decile 7 | 262 |
| Decile 6 | 262 |
| Median | 258 |
| Decile 4 | 258 |
| Decile 3 | 254 |
| Decile 2 | 254 |
| Decile 1 | 250 |
| Minimum | -1 |
|
|
- There are 99 distinct values.
- Mean = 259.308
- Std.dev = 29.3903
- 1847 items below graph minimum of 226
- 1873 items above graph maximum of 298
|
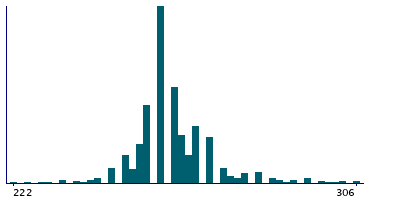
Instance 1 : First repeat assessment visit (2012-13)
15,562 participants, 15,562 items
| Maximum | 450 |
| Decile 9 | 278 |
| Decile 8 | 270 |
| Decile 7 | 266 |
| Decile 6 | 262 |
| Median | 258 |
| Decile 4 | 258 |
| Decile 3 | 258 |
| Decile 2 | 254 |
| Decile 1 | 250 |
| Minimum | -1 |
|
|
- There are 99 distinct values.
- Mean = 260.675
- Std.dev = 43.6169
- 881 items below graph minimum of 222
- 870 items above graph maximum of 306
|
Notes
This field should be used to quality control the values generated by the Topcon Advanced Boundary Segmentation [TABS] software in
Category 100079. Information about how the research group who generated the values quality controlled them for their publication can be seen in
Return 1875.
0 Related Data-Fields
There are no related data-fields
0 Resources
There are no matching Resources
