Data
82,781 items of data are available, covering 82,781 participants.
Defined-instances run from 0 to 1, labelled using Instancing
2.
| Maximum | 113 |
| Decile 9 | 74 |
| Decile 8 | 69 |
| Decile 7 | 67 |
| Decile 6 | 66 |
| Median | 66 |
| Decile 4 | 65 |
| Decile 3 | 65 |
| Decile 2 | 64 |
| Decile 1 | 63 |
| Minimum | -1 |
|
|
- There are 99 distinct values.
- Mean = 66.8118
- Std.dev = 9.08717
- 2239 items below graph minimum of 52
- 3469 items above graph maximum of 85
|
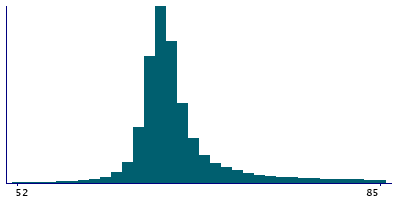
2 Instances
Instance 0 : Initial assessment visit (2006-2010) at which participants were recruited and consent given
67,219 participants, 67,219 items
| Maximum | 113 |
| Decile 9 | 74 |
| Decile 8 | 69 |
| Decile 7 | 67 |
| Decile 6 | 66 |
| Median | 66 |
| Decile 4 | 65 |
| Decile 3 | 65 |
| Decile 2 | 64 |
| Decile 1 | 63 |
| Minimum | -1 |
|

|
- There are 99 distinct values.
- Mean = 66.8139
- Std.dev = 8.56442
- 1514 items below graph minimum of 52
- 2565 items above graph maximum of 85
|
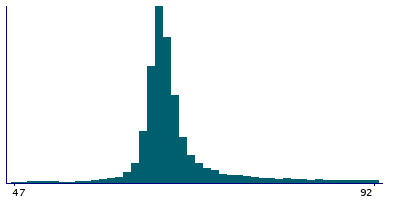
Instance 1 : First repeat assessment visit (2012-13)
15,562 participants, 15,562 items
| Maximum | 113 |
| Decile 9 | 77 |
| Decile 8 | 69 |
| Decile 7 | 67 |
| Decile 6 | 66 |
| Median | 66 |
| Decile 4 | 65 |
| Decile 3 | 65 |
| Decile 2 | 64 |
| Decile 1 | 62 |
| Minimum | -1 |
|
|
- There are 99 distinct values.
- Mean = 66.803
- Std.dev = 11.065
- 600 items below graph minimum of 47
- 551 items above graph maximum of 92
|
Notes
This field should be used to quality control the values generated by the Topcon Advanced Boundary Segmentation [TABS] software in
Category 100079. Information about how the research group who generated the values quality controlled them for their publication can be seen in
Return 1875.
0 Related Data-Fields
There are no related data-fields
0 Resources
There are no matching Resources
