Data
282,808 items of data are available, covering 220,783 participants.
Some values have special meanings defined by Data-Coding
100291.
Defined-instances run from 0 to 3, labelled using Instancing
2.
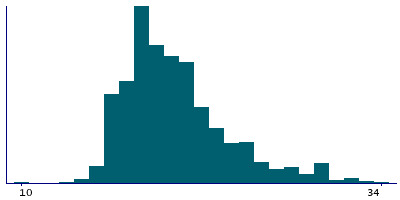
Units of measurement are years.
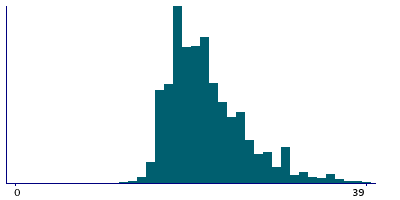
| Maximum | 55 |
| Decile 9 | 28 |
| Decile 8 | 25 |
| Decile 7 | 23 |
| Decile 6 | 21 |
| Median | 20 |
| Decile 4 | 19 |
| Decile 3 | 18 |
| Decile 2 | 18 |
| Decile 1 | 17 |
| Minimum | 5 |
|
|
- There are 51 distinct values.
- Mean = 21.385
- Std.dev = 4.60453
- 1648 items above graph maximum of 39
- 454 items have value -3 (Prefer not to answer)
- 9978 items have value -1 (Do not know)
|
4 Instances
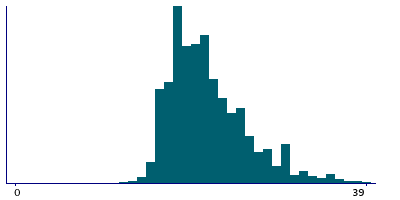
Instance 0 : Initial assessment visit (2006-2010) at which participants were recruited and consent given
220,137 participants, 220,137 items
| Maximum | 55 |
| Decile 9 | 28 |
| Decile 8 | 25 |
| Decile 7 | 23 |
| Decile 6 | 22 |
| Median | 21 |
| Decile 4 | 20 |
| Decile 3 | 19 |
| Decile 2 | 18 |
| Decile 1 | 17 |
| Minimum | 5 |
|
|
- There are 51 distinct values.
- Mean = 21.5365
- Std.dev = 4.6723
- 1318 items above graph maximum of 39
- 387 items have value -3 (Prefer not to answer)
- 7784 items have value -1 (Do not know)
|
Instance 1 : First repeat assessment visit (2012-13)
8,453 participants, 8,453 items
| Maximum | 55 |
| Decile 9 | 27 |
| Decile 8 | 25 |
| Decile 7 | 23 |
| Decile 6 | 22 |
| Median | 21 |
| Decile 4 | 20 |
| Decile 3 | 19 |
| Decile 2 | 18 |
| Decile 1 | 17 |
| Minimum | 6 |
|
|
- There are 41 distinct values.
- Mean = 21.6559
- Std.dev = 4.50094
- 68 items above graph maximum of 37
- 8 items have value -3 (Prefer not to answer)
- 265 items have value -1 (Do not know)
|
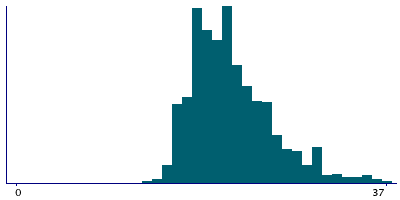
Instance 2 : Imaging visit (2014+)
45,004 participants, 45,004 items
| Maximum | 55 |
| Decile 9 | 26 |
| Decile 8 | 23 |
| Decile 7 | 22 |
| Decile 6 | 21 |
| Median | 20 |
| Decile 4 | 19 |
| Decile 3 | 18 |
| Decile 2 | 18 |
| Decile 1 | 16 |
| Minimum | 5 |
|
|
- There are 47 distinct values.
- Mean = 20.7487
- Std.dev = 4.29202
- 336 items above graph maximum of 36
- 49 items have value -3 (Prefer not to answer)
- 1593 items have value -1 (Do not know)
|
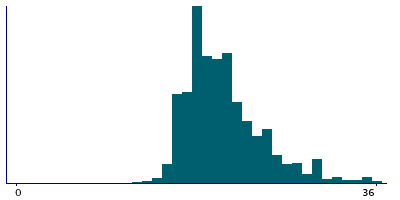
Instance 3 : First repeat imaging visit (2019+)
9,214 participants, 9,214 items
| Maximum | 50 |
| Decile 9 | 26 |
| Decile 8 | 23 |
| Decile 7 | 22 |
| Decile 6 | 21 |
| Median | 20 |
| Decile 4 | 19 |
| Decile 3 | 18 |
| Decile 2 | 18 |
| Decile 1 | 16 |
| Minimum | 6 |
|
|
- There are 39 distinct values.
- Mean = 20.6266
- Std.dev = 4.17951
- 68 items above graph maximum of 36
- 10 items have value -3 (Prefer not to answer)
- 336 items have value -1 (Do not know)
|
Notes
ACE touchscreen question "About how old were you when you first went on the contraceptive pill?"
The following checks were performed:
- If answer < 5 then rejected
- If answer > Participants age then rejected
- If answer < 10 then participant asked to confirm
- If answer > 50 then participant asked to confirm
If the participant activated the Help button they were shown the message:
If you are unsure, please provide an estimate or select Do not know.
|
Field 2794 was collected from women who indicated that they had taken the contraceptive pill, as defined by their answers to Field 2784
Coding 100291 defines 2 special values:
- -1 represents "Do not know"
- -3 represents "Prefer not to answer"
1 Related Data-Field
| Field ID | Description | Relationship |
|---|
| 2784 | Ever taken oral contraceptive pill | Current Field was collected from women who indicated that they had taken the contraceptive pill, as defined by their answers to Field 2784 |
4 Applications
| Application ID | Title |
|---|
| 26629 | Cross-cultural variations in female reproductive health and non-communicable diseases: analysis of 500,000 participants from the UKBiobank and the InterLACE consortium |
| 5791 | Development and validation of risk prediction model for breast and ovarian cancers |
| 17435 | Exploring the genetics of irritable bowel syndrome: the ?bellygenes? initiative (project approved by bbmri-lpc) |
| 871 | Genetic factors associated with being at different extremes of the reproductive lifespan |


