Data
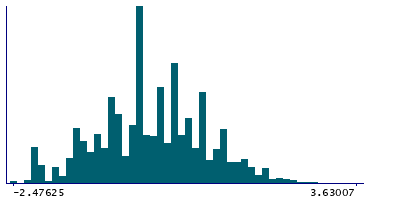
60,915 items of data are available, covering 60,915 participants.
Defined-instances run from 0 to 1, labelled using Instancing
2.
Units of measurement are ratio.
| Maximum | 3.63007 |
| Decile 9 | 1.2765 |
| Decile 8 | 0.883583 |
| Decile 7 | 0.451686 |
| Decile 6 | 0.218525 |
| Median | -0.0436084 |
| Decile 4 | -0.229835 |
| Decile 3 | -0.630063 |
| Decile 2 | -0.898371 |
| Decile 1 | -1.3121 |
| Minimum | -2.47625 |
|
|
- Mean = -0.0177798
- Std.dev = 0.966629
|
2 Instances
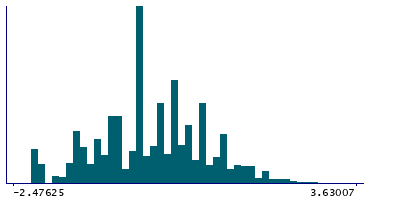
Instance 0 : Initial assessment visit (2006-2010) at which participants were recruited and consent given
47,823 participants, 47,823 items
| Maximum | 3.63007 |
| Decile 9 | 1.2765 |
| Decile 8 | 0.883583 |
| Decile 7 | 0.451686 |
| Decile 6 | 0.174216 |
| Median | -0.18252 |
| Decile 4 | -0.229835 |
| Decile 3 | -0.630063 |
| Decile 2 | -0.898371 |
| Decile 1 | -1.3121 |
| Minimum | -2.47625 |
|
|
- Mean = -0.0152809
- Std.dev = 0.968032
|
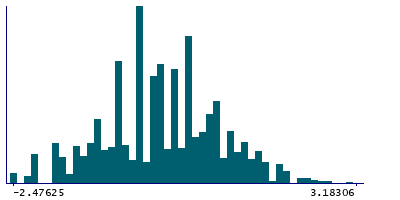
Instance 1 : First repeat assessment visit (2012-13)
13,092 participants, 13,092 items
| Maximum | 3.18306 |
| Decile 9 | 1.28187 |
| Decile 8 | 0.850154 |
| Decile 7 | 0.418144 |
| Decile 6 | 0.218525 |
| Median | -0.0436084 |
| Decile 4 | -0.382689 |
| Decile 3 | -0.446217 |
| Decile 2 | -0.759909 |
| Decile 1 | -1.26417 |
| Minimum | -2.47625 |
|
|
- Mean = -0.026908
- Std.dev = 0.961433
- 2 items above graph maximum of 3.18306
|
Notes
Values regressed on disc diameter and inverse rank transformation applied. For derivation see
Resource 955.
0 Related Data-Fields
There are no related data-fields

