Data
4,316 items of data are available, covering 4,316 participants.
Defined-instances run from 0 to 1, labelled using Instancing
2.
Units of measurement are mm.
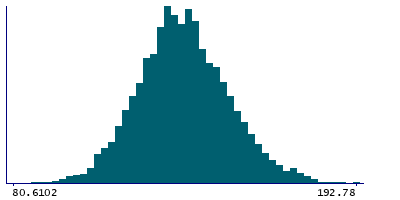
| Maximum | 226 |
| Decile 9 | 155.39 |
| Decile 8 | 148.212 |
| Decile 7 | 143.087 |
| Decile 6 | 139.014 |
| Median | 136 |
| Decile 4 | 132.015 |
| Decile 3 | 128.472 |
| Decile 2 | 124.004 |
| Decile 1 | 118 |
| Minimum | 80.0033 |
|
|
- Mean = 136.261
- Std.dev = 14.9662
- 1 item below graph minimum of 80.6102
- 6 items above graph maximum of 192.78
|
2 Instances
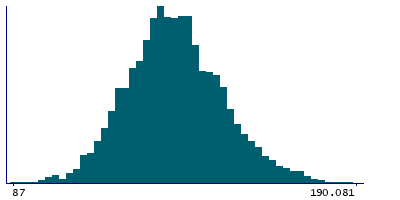
Instance 0 : Initial assessment visit (2006-2010) at which participants were recruited and consent given
3,229 participants, 3,229 items
| Maximum | 226 |
| Decile 9 | 154.052 |
| Decile 8 | 147.45 |
| Decile 7 | 142.056 |
| Decile 6 | 138.817 |
| Median | 135.004 |
| Decile 4 | 131.155 |
| Decile 3 | 128.002 |
| Decile 2 | 123.558 |
| Decile 1 | 118 |
| Minimum | 87 |
|
|
- Mean = 135.645
- Std.dev = 14.6636
- 5 items above graph maximum of 190.104
|
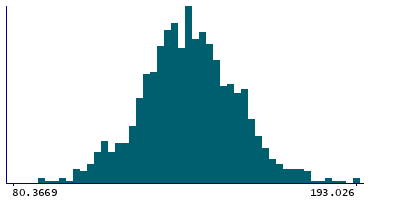
Instance 1 : First repeat assessment visit (2012-13)
1,087 participants, 1,087 items
| Maximum | 193.026 |
| Decile 9 | 157.642 |
| Decile 8 | 151.141 |
| Decile 7 | 146.009 |
| Decile 6 | 142.014 |
| Median | 138.033 |
| Decile 4 | 134.034 |
| Decile 3 | 130.096 |
| Decile 2 | 125.608 |
| Decile 1 | 119.004 |
| Minimum | 80.0033 |
|
|
- Mean = 138.092
- Std.dev = 15.689
- 1 item below graph minimum of 80.3669
|

