Data
87,996 items of data are available, covering 83,313 participants.
Defined-instances run from 2 to 3, labelled using Instancing
2.
Units of measurement are mm3.
| Maximum | 1796.9 |
| Decile 9 | 887.04 |
| Decile 8 | 840.69 |
| Decile 7 | 808.997 |
| Decile 6 | 782.582 |
| Median | 759.004 |
| Decile 4 | 736.154 |
| Decile 3 | 712.399 |
| Decile 2 | 686.203 |
| Decile 1 | 651.815 |
| Minimum | 409.184 |
|
|
- Mean = 765.208
- Std.dev = 92.7964
- 1 item below graph minimum of 416.589
- 74 items above graph maximum of 1122.26
|
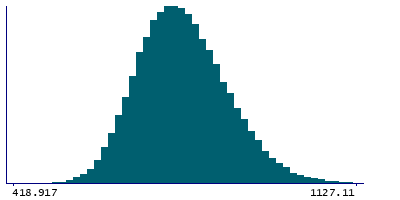
2 Instances
Instance 2 : Imaging visit (2014+)
83,241 participants, 83,241 items
| Maximum | 1796.9 |
| Decile 9 | 886.537 |
| Decile 8 | 840.361 |
| Decile 7 | 808.625 |
| Decile 6 | 782.232 |
| Median | 758.597 |
| Decile 4 | 735.751 |
| Decile 3 | 711.948 |
| Decile 2 | 685.834 |
| Decile 1 | 651.424 |
| Minimum | 409.184 |
|

|
- Mean = 764.815
- Std.dev = 92.7379
- 1 item below graph minimum of 416.312
- 68 items above graph maximum of 1121.65
|
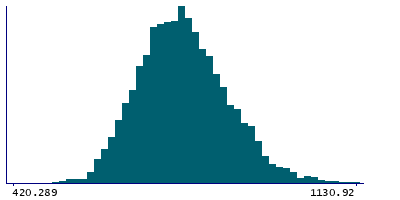
Instance 3 : First repeat imaging visit (2019+)
4,755 participants, 4,755 items
| Maximum | 1676.24 |
| Decile 9 | 893.991 |
| Decile 8 | 847.429 |
| Decile 7 | 815.686 |
| Decile 6 | 789.164 |
| Median | 766.63 |
| Decile 4 | 743.881 |
| Decile 3 | 719.216 |
| Decile 2 | 693.842 |
| Decile 1 | 657.166 |
| Minimum | 418.69 |
|
|
- Mean = 772.083
- Std.dev = 93.5489
- 1 item below graph minimum of 420.341
- 5 items above graph maximum of 1130.82
|
Notes
Volume of VLp in the right hemisphere generated by subcortical volumetric sub-segmentation of the Thalamic Nuclei
0 Related Data-Fields
There are no related data-fields
0 Resources
There are no matching Resources
