Data
87,996 items of data are available, covering 83,313 participants.
Defined-instances run from 2 to 3, labelled using Instancing
2.
Units of measurement are mm3.
| Maximum | 136.77 |
| Decile 9 | 64.6232 |
| Decile 8 | 60.1629 |
| Decile 7 | 57.1335 |
| Decile 6 | 54.5864 |
| Median | 52.2854 |
| Decile 4 | 50.0303 |
| Decile 3 | 47.6859 |
| Decile 2 | 44.9911 |
| Decile 1 | 41.4388 |
| Minimum | 16.6103 |
|

|
- Mean = 52.761
- Std.dev = 9.17008
- 94 items above graph maximum of 87.8076
|
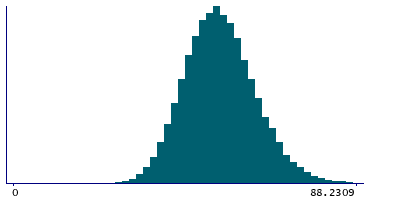
2 Instances
Instance 2 : Imaging visit (2014+)
83,241 participants, 83,241 items
| Maximum | 136.77 |
| Decile 9 | 64.5896 |
| Decile 8 | 60.1244 |
| Decile 7 | 57.076 |
| Decile 6 | 54.5377 |
| Median | 52.2411 |
| Decile 4 | 49.989 |
| Decile 3 | 47.6419 |
| Decile 2 | 44.9455 |
| Decile 1 | 41.395 |
| Minimum | 16.6103 |
|
|
- Mean = 52.7152
- Std.dev = 9.17454
- 88 items above graph maximum of 87.7842
|
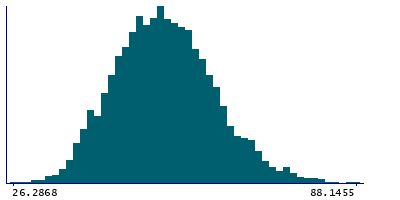
Instance 3 : First repeat imaging visit (2019+)
4,755 participants, 4,755 items
| Maximum | 103.671 |
| Decile 9 | 65.2141 |
| Decile 8 | 60.9512 |
| Decile 7 | 58.0192 |
| Decile 6 | 55.5216 |
| Median | 53.1106 |
| Decile 4 | 50.8919 |
| Decile 3 | 48.4713 |
| Decile 2 | 45.7966 |
| Decile 1 | 42.2828 |
| Minimum | 26.2868 |
|
|
- Mean = 53.5634
- Std.dev = 9.05427
- 6 items above graph maximum of 88.1455
|
Notes
Volume of CeM in the right hemisphere generated by subcortical volumetric sub-segmentation of the Thalamic Nuclei
0 Related Data-Fields
There are no related data-fields
0 Resources
There are no matching Resources
